
Email deliverability can really make or break an email marketing campaign. Most marketers know the theory behind boosting email deliverability rates – building and managing clean lists, keeping subscribers engaged, developing a good sender reputation, and so on.
But many also know from experience that you can do everything by the book and still have your emails mysteriously disappear after being sent.
Based on our bi-annual email deliverability test, we’ve confirmed what many marketers have long suspected – different email marketing services do have different deliverability rates. And the differences, in some cases, are quite startling.
As a result, we’ve decided to share our results, and have committed to performing regular tests to make sure our results are always up to date. We’ll continue to add them to this page with each round of tests to show you who has the best email deliverability!
Because we believe email deliverability should be an important factor when deciding on which email tool is right for your business, we’ve also now added this as a criterion to each of our reviews.
Email Service Providers: Average Deliverability Rate
Over the years, we’ve seen fluctuations in the deliverability of the email service providers (ESPs) we monitor. This table gives you the average scores from our last three email deliverability tests (approximately a year and a half).
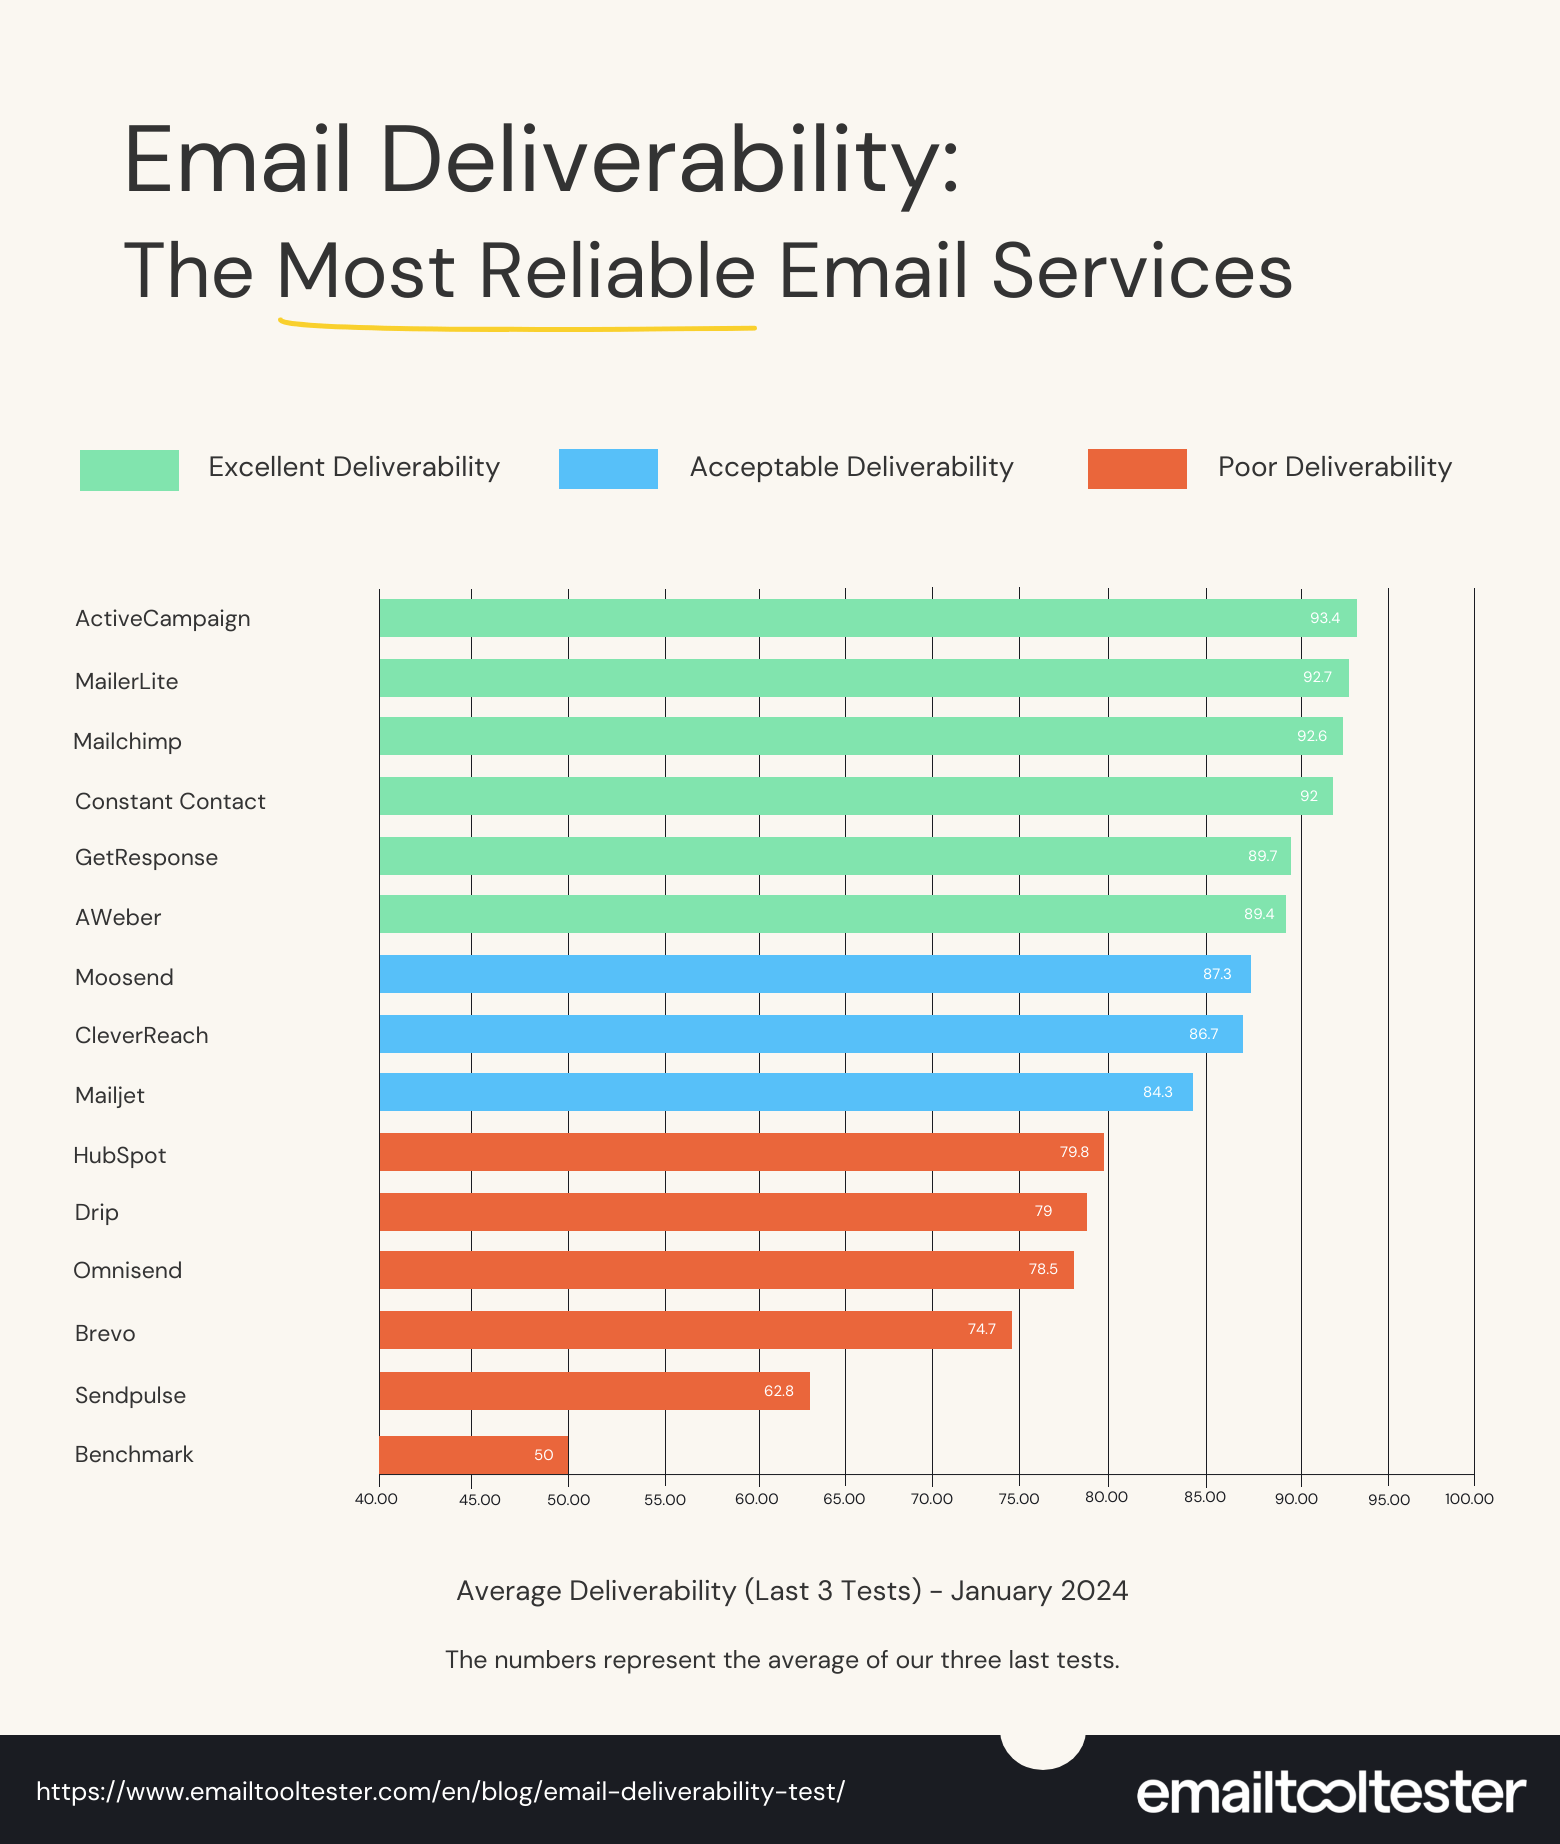
We're happy to see that popular email marketing services like Brevo and ActiveCampaign, saw a slight increase over the last two rounds. It's safe to say that in previous rounds we’ve been left a little disappointed with their scores.
MailerLite kept their “best of 5” award with an average deliverability rate of 94.41% over the last five rounds.
ActiveCampaign reclaimed their number 1 spot with a deliverability rate of 94.2%. We are proud to present them with our “best email deliverability” award!


You can find the results from all our tests in the table below.
What Is a Good Email Deliverability Rate?
Anything above a deliverability rate of 89% is considered excellent according to our methodology. Rates from 88 to 83% are considered acceptable. Any rate lower than that is considered poor. As you can see from this latest round, the scores mostly be classed as acceptable and poor.
A correctly delivered email is defined as an email that arrives in the recipient's inbox, which includes the promotions folders that some email providers provide (e.g. Gmail). Undelivered emails are those that land in spam or do not arrive at all (e.g., bounced messages).
The average deliverability rate in our tests is 83.1% across all tested email service providers currently. That means 16.9% of all emails never reach their intended destination.

Email Deliverability Test: Results Over Time
These rates represent an average derived from the five email deliverability tests in each testing round.
| Provider | Aug 2017 % | Mar 2018 % | Jan 2019 % | July 2019 % | Feb 2020 % | Sept 2020 % | Mar 2021 % | Oct 2021 % | Apr 2022 % | Jan 2023 % | June 2023 % | Jan 2024 % |
|---|---|---|---|---|---|---|---|---|---|---|---|---|
| ActiveCampaign | 85.8 | 96 | 97 | 93.8 | 90.2 | 73 | 91.1 | 91.6 | 90.2 | 93 | 93.1 | 94.2 |
| AWeber | 80.3 | 79.8 | 75.6 | 80.4 | 85.4 | 83 | 77.6 | 72.1 | 71.8 | 92 | 93.2 | 83.1 |
| Benchmark | 63.9 | 75.8 | 49.2 | 41.8 | 45.2 | 66 | 75.1 | 49.6 | 40.3 | 40.1 | 62.8 | 47.1 |
| Constant Contact | 89.74 | 93 | 90.4 | 88 | 89.4 | 89 | 91.5 | 87.7 | 90.9 | 92.1 | 92 | 91.7 |
| ConvertKit | 92.1 | 88 | 81 | 91.4 | 60 | 95 | 96.3 | 93.6 | 88.7 | 81.5 | 91.3 | Not tested* |
| Drip | 89.14 | 89.8 | Not tested | 88.8 | 78.8 | 86 | 87.9 | 81.3 | 77.5 | 62 | 86.7 | 88.2 |
| GetResponse | 87.5 | 78 | 80.6 | 85.4 | 75.6 | 86 | 83.8 | 76.1 | 82.9 | 87.4 | 91.3 | 90.9 |
| Mailchimp | 87.52 | 82.6 | 81.6 | 90.6 | 81.6 | 91 | 86.9 | 85.2 | 85.9 | 92.7 | 95.5 | 89.5 |
| MailerLite | 77.6 | 89 | 92.6 | 94.8 | 78.4 | 90 | 96.9 | 95.7 | 98 | 91.7 | 96.5 | 89.8 |
| Brevo (Sendinblue) | 83.9 | 75.6 | 77.4 | 88.8 | 95.4 | 76 | 96.3 | 84.6 | 90 | 68.2 | 67.7 | 88.3 |
| Mailjet | Not tested | Not tested | Not tested | 84.8 | 94.6 | 94 | 89.6 | 77.8 | 86.1 | 84.2 | 80.6 | 88.0 |
| CleverReach | Not tested | Not tested | Not tested | 79.6 | 80.8 | 93 | 94.3 | 93.3 | 96.5 | 90.9 | 79.3 | 90.0 |
| HubSpot | Not tested | Not tested | Not tested | Not tested | Not tested | Not tested | 91.6 | 67.1 | 68.4 | 81.3 | 80.2 | 77.7 |
| Moosend | Not tested | Not tested | Not tested | Not tested | Not tested | Not tested | 88.7 | 88.1 | 80.3 | 83.7 | 88.1 | 90.1 |
| Omnisend | Not tested | Not tested | Not tested | Not tested | Not tested | Not tested | 85.1 | 85.3 | 67.6 | 72.5 | 87.9 | 75.1 |
| Sendpulse | Not tested | Not tested | Not tested | Not tested | Not tested | Not tested | Not tested | Not tested | Not tested | Not tested | Not tested | 62.8 |
| Overall Average | 83.75 | 84.76 | 79.68 | 83.8 | 79.6 | 85.2 | 88.9 | 85.3 | 84.2 | 81 | 85.7 | 81.3 |
*Due to a technical limitation on ConvertKit's end, we weren't able to set up DMARC authentication for our sender subdomain. We hope ConvertKit will enable this feature for our upcoming test rounds.
Note: The winners of each round are highlighted in bold
For an analysis of each of the individual test rounds, please follow these blog links:
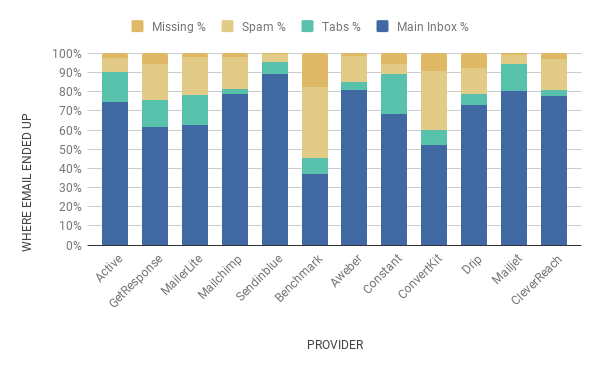
Email deliverability test January 2024
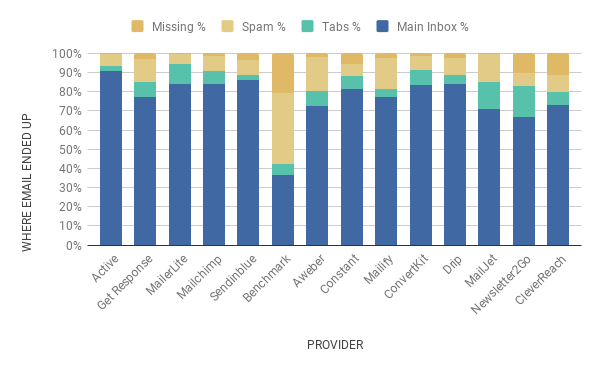
Email deliverability test June 2023
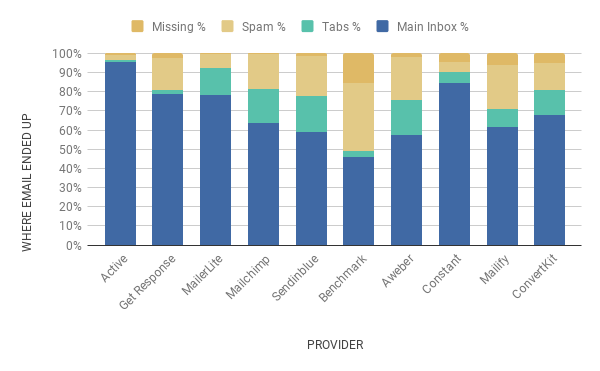
Email deliverability test Jan 2023
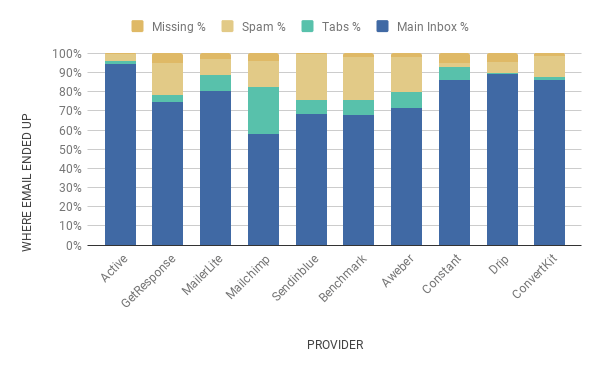
Email deliverability test April 2022
Email deliverability test October 2021
Email deliverability test March 2021
As you can see, email deliverability rates can fluctuate over time. Even providers that have done consistently well (ActiveCampaign and MailerLite) have seen surprising results in the past. There are also those that consistently perform pretty badly (Benchmark). This round they scored even worse than the last with an average deliverability of 47.1%
For an analysis of the most recent results, see the blog post (and infographic) from our latest round of email deliverability tests.
The average deliverability for all tools combined was 83.1% in our latest round of tests. That means 16.9% of all emails have either gone completely missing or have been caught by popular spam filters. Unfortunately, the average was a lot higher in the previous round (85.7%).
However, this is consistent with the results achieved through Return Path's research, which found that the average global inbox placement rate was 83%.
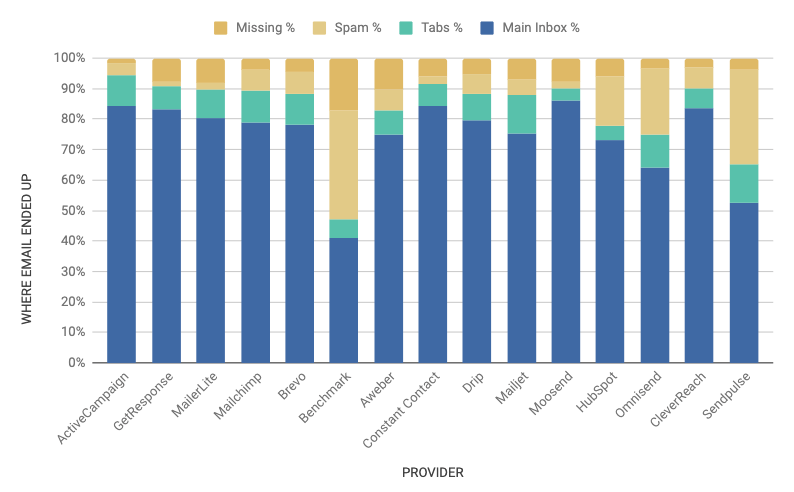
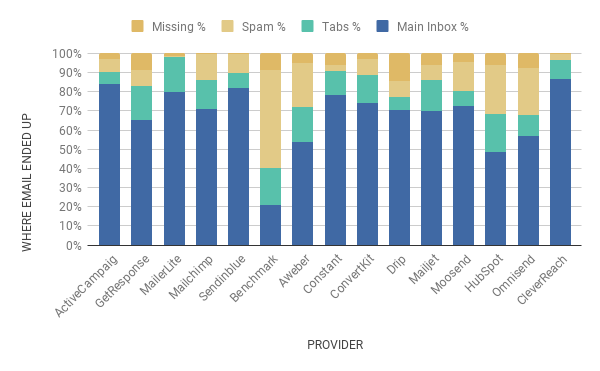
Where Exactly Are Emails Landing?
It’s no surprise that there’s a direct correlation between low email deliverability rates, and high rates of email flagged as spam. Below is a breakdown of where exactly emails ended up (whether it was the main inbox, a secondary tab, spam folder, or if the emails went missing), in each test round we’ve completed.
Inbox placement rates January 2024
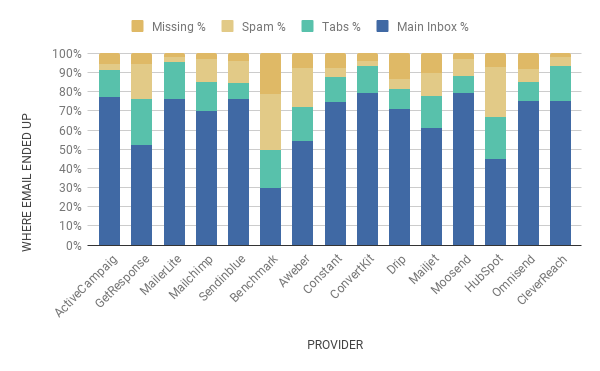
Inbox placement rates June 2023
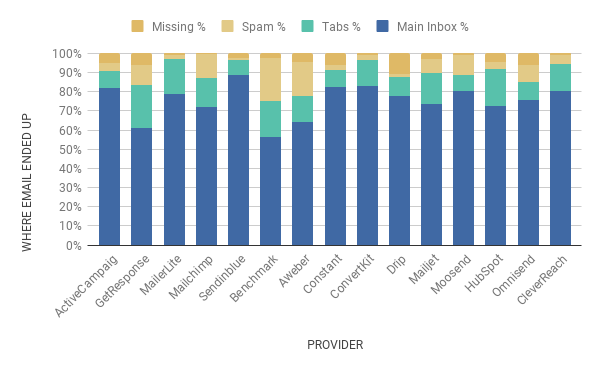
Inbox placement rates January 2023
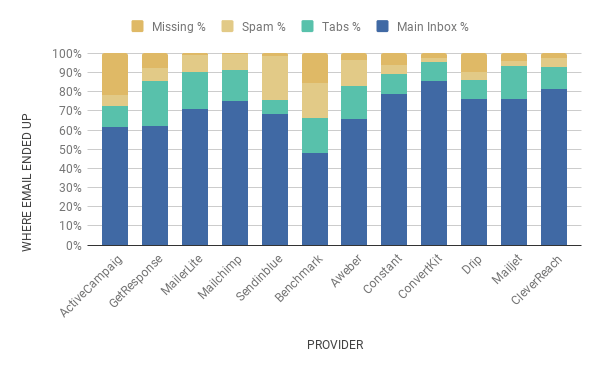
Inbox placement rates April 2022
Inbox placement rates October 2021
Inbox placement rates March 2021
Inbox placement rates September 2020
Inbox placement rates February 2020
Inbox placement rates July 2019
Inbox placement rates January 2019
Inbox placement rates March 2018
Inbox placement rates August 2017
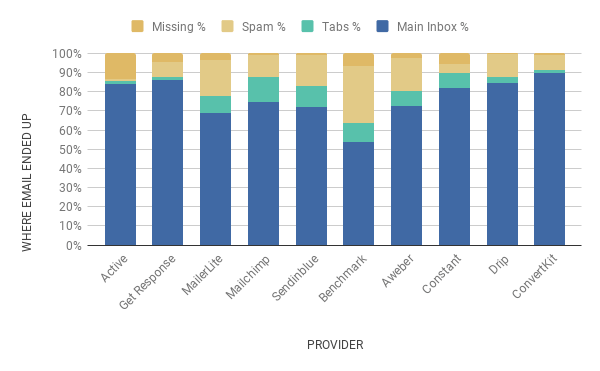
Based on these results, we can start to see some general trends:
- Benchmark tends to have a higher proportion of emails get filtered to spam. On the other hand, the same emails sent through GetResponse and Mailerlite were much less likely to be marked as spam
- We found that there were a lot fewer emails being delivered to promotional tabs, and we think this is because of the extra authentication steps we introduced. We ensured that all of the providers involved had DKIM, SPF, and DMARC set up.
Email Deliverability Test: Rates by Internet Service Provider (ISP)
Thanks to the email deliverability testing tool Glockapps.com, we were able to see just how well each newsletter service performed in getting delivered to the four main ISPs – Gmail, Microsoft (Outlook and Hotmail), Yahoo and AOL. Based on our results, you can see that certain ISPs definitely look more favorably upon some tools than on others.
Please keep in mind that Glockapps sometimes adds or removes ISPs/a particular email client to reflect their current popularity on the market.
Deliverability to Gmail
| Provider | Aug 2017 % | Mar 2018 % | Jan 2019 % | July 2019 % | Feb 2020 % | Sept 2020 % | Mar 2021 % | Oct 2021 % | Apr 2022 % | Jan 2023 % | June 2023 % | Jan 2024 % |
|---|---|---|---|---|---|---|---|---|---|---|---|---|
| ActiveCampaign | 100 | 100 | 100 | 95 | 76 | 100 | 100 | 100 | 100 | 100 | 95 | 100 |
| AWeber | 100 | 100 | 100 | 83 | 81 | 92.6 | 92 | 92 | 100 | 100 | 95 | 81 |
| Benchmark | 50 | 100 | 0 | 13 | 34 | 100 | 100 | 83 | 96 | 100 | 100 | 86 |
| Constant Contact | 50 | 100 | 100 | 95 | 94 | 100 | 100 | 100 | 100 | 100 | 100 | 100 |
| ConvertKit | 100 | 100 | 100 | 95 | 80 | 100 | 100 | 100 | 76 | 100 | 95 | Not tested |
| Drip | 100 | 100 | Not tested | 86.7 | 64 | 100 | 100 | 91 | 85 | 86 | 96 | 97 |
| GetResponse | 50 | 100 | 100 | 95 | 68 | 100 | 100 | 100 | 100 | 100 | 100 | 100 |
| MailChimp | 100 | 100 | 100 | 95 | 69 | 100 | 100 | 100 | 100 | 100 | 98 | 100 |
| MailerLite | 100 | 100 | 100 | 95 | 70 | 100 | 100 | 97 | 100 | 80 | 95 | 97 |
| Brevo | 100 | 100 | 100 | 95 | 93 | 100 | 100 | 95 | 98 | 80 | 78 | 100 |
| Mailjet | Not tested | Not tested | Not tested | 95 | 91 | 100 | 100 | 97 | 100 | 100 | 95 | 80 |
| CleverReach | Not tested | Not tested | Not tested | 89 | 82 | 100 | 100 | 100 | 100 | 100 | 95 | 86 |
| HubSpot | Not tested | Not tested | Not tested | Not tested | Not tested | Not tested | 100 | 100 | 100 | 100 | 95 | 98 |
| Moosend | Not tested | Not tested | Not tested | Not tested | Not tested | Not tested | 100 | 100 | 100 | 100 | 100 | 100 |
| Omnisend | Not tested | Not tested | Not tested | Not tested | Not tested | Not tested | 100 | 100 | 100 | 100 | 95 | 94 |
| Sendpulse | Not tested | Not tested | Not tested | Not tested | Not tested | Not tested | Not tested | Not tested | Not tested | Not tested | Not tested | 100 |
Deliverability to Microsoft (Outlook and Hotmail)
| Provider | Aug 2017 % | Mar 2018 % | Jan 2019 % | July 2019 % | Feb 2020 % | Sept 2020 % | Mar 2021 % | Oct 2021 % | Apr 2022 % | Jan 2023 % | June 2023 % | Jan 2024 % |
| ActiveCampaign | 50 | 100 | 100 | 100 | 100 | 48.6 | 100 | 94.3 | 80 | 100 | 97.4 | 100 |
| AWeber | 0 | 18 | 0 | 56.9 | 60 | 61.4 | 24.3 | 7.1 | 2.9 | 95.7 | 98.7 | 100 |
| Benchmark | 0 | 0 | 0 | 33.8 | 23.1 | 51.4 | 71.4 | 0 | 0 | 0 | 94.5 | 93.3 |
| Constant Contact | 84.4 | 100 | 100 | 100 | 98.5 | 100 | 100 | 94.3 | 100 | 100 | 100 | 85.3 |
| ConvertKit | 84.4 | 69 | 75 | 95.4 | 0 | 100 | 98.6 | 95.7 | 98.6 | 40 | 96 | Not tested |
| Drip | 0 | 100 | Not tested | 100 | 100 | 94.3 | 100 | 95.7 | 94.3 | 0 | 94.7 | 97.3 |
| GetResponse | 50 | 20 | 20 | 60 | 56.9 | 80 | 60 | 15.7 | 80 | 100 | 97.1 | 94.7 |
| MailChimp | 50 | 24 | 31 | 80 | 80 | 80 | 60 | 74.3 | 60 | 100 | 98.7 | 100 |
| MailerLite | 0 | 100 | 100 | 100 | 32.3 | 61.4 | 100 | 95.7 | 100 | 80 | 97.4 | 94.7 |
| Brevo | 50 | 7 | 0 | 78.5 | 98.5 | 100 | 100 | 95.7 | 95.7 | 100 | 40 | 9.3 |
| Mailjet | Not tested | Not tested | Not tested | 43.1 | 100 | 100 | 71.4 | 76.2 | 78.6 | 80 | 70.3 | 100 |
| CleverReach | Not tested | Not tested | Not tested | 100 | 63.1 | 98.6 | 98.6 | 95.7 | 97.1 | 100 | 96 | 62.7 |
| HubSpot | Not tested | Not tested | Not tested | Not tested | Not tested | Not tested | 94.3 | 16.1 | 27.1 | 95.7 | 89.2 | 38.7 |
| Moosend | Not tested | Not tested | Not tested | Not tested | Not tested | Not tested | 98.6 | 94.2 | 80 | 100 | 100 | 54.7 |
| Omnisend | Not tested | Not tested | Not tested | Not tested | Not tested | Not tested | 80 | 92.9 | 0 | 20 | 100 | 100 |
| Sendpulse | Not tested | Not tested | Not tested | Not tested | Not tested | Not tested | Not tested | Not tested | Not tested | Not tested | Not tested | 0 |
Deliverability to Yahoo
| Provider | Aug 2017 % | Mar 2018 % | Jan 2019 % | July 2019 % | Feb 2020 % | Sept 2020 % | Mar 2021 % | Oct 2021 % | Apr 2022 % | Jan 2023 % | June 2023 % | Jan 2024 % |
| ActiveCampaign | 100 | 100 | 100 | 100 | 90 | 91.1 | 82 | 89 | 100 | 100 | 100 | 100 |
| AWeber | 100 | 100 | 100 | 100 | 100 | 100 | 100 | 89 | 100 | 100 | 100 | 100 |
| Benchmark | 100 | 100 | 100 | 20 | 7.5 | 20 | 40 | 0 | 0 | 23 | 0 | 60 |
| Constant Contact | 100 | 100 | 100 | 100 | 100 | 100 | 100 | 100 | 100 | 100 | 100 | 100 |
| ConvertKit | 100 | 100 | 97.5 | 100 | 97.5 | 100 | 100 | 100 | 100 | 100 | 100 | Not tested |
| Drip | 100 | 100 | Not tested | 100 | 100 | 100 | 100 | 100 | 100 | 100 | 58 | 60 |
| GetResponse | 100 | 97.5 | 100 | 95 | 100 | 100 | 100 | 100 | 100 | 100 | 100 | 100 |
| MailChimp | 100 | 100 | 100 | 100 | 100 | 100 | 100 | 89 | 100 | 100 | 100 | 100 |
| MailerLite | 100 | 100 | 100 | 100 | 100 | 100 | 100 | 100 | 100 | 100 | 100 | 80 |
| Brevo | 100 | 100 | 97.5 | 100 | 82 | 0 | 100 | 78 | 100 | 20 | 20 | 60 |
| Mailjet | Not tested | Not tested | Not tested | 100 | 100 | 95.6 | 82 | 36 | 71 | 98 | 95 | 93 |
| CleverReach | Not tested | Not tested | Not tested | 100 | 87.5 | 97.8 | 100 | 100 | 100 | 80 | 47 | 93 |
| HubSpot | Not tested | Not tested | Not tested | Not tested | Not tested | Not tested | 98 | 100 | 100 | 100 | 100 | 93 |
| Moosend | Not tested | Not tested | Not tested | Not tested | Not tested | Not tested | 100 | 100 | 100 | 100 | 100 | 100 |
| Omnisend | Not tested | Not tested | Not tested | Not tested | Not tested | Not tested | 100 | 100 | 100 | 100 | 100 | 100 |
| Sendpulse | Not tested | Not tested | Not tested | Not tested | Not tested | Not tested | Not tested | Not tested | Not tested | Not tested | Not tested | 13 |
Deliverability to AOL
| Provider | Aug 2017 % | Mar 2018 % | Jan 2019 % | July 2019 % | Feb 2020 % | Sept 2020 % | Mar 2021 % | Oct 2021 % | Apr 2022 % | Jan 2023 % | June 2023 % | Jan 2024 % |
| ActiveCampaign | 7.1 | 100 | 100 | 100 | 97.1 | 0 | 100 | 100 | 100 | 100 | 100 | 100 |
| AWeber | 100 | 100 | 80 | 100 | 100 | 100 | 100 | 100 | 100 | 100 | 100 | 100 |
| Benchmark | 0 | 80 | 100 | 20 | 0 | 20 | 40 | 0 | 20 | 0 | 0 | 0 |
| Constant Contact | 92.9 | 100 | 100 | 97.1 | 100 | 100 | 100 | 100 | 100 | 100 | 100 | 100 |
| ConvertKit | 100 | 100 | 100 | 100 | 97.1 | 100 | 100 | 100 | 100 | 100 | 100 | Not tested |
| Drip | 100 | 100 | Not tested | 100 | 85.7 | 74.3 | 71 | 71 | 71 | 71 | 57 | 80 |
| GetResponse | 85.7 | 100 | 100 | 94.3 | 100 | 100 | 100 | 100 | 100 | 100 | 100 | 100 |
| MailChimp | 100 | 100 | 100 | 100 | 100 | 100 | 100 | 100 | 100 | 100 | 100 | 100 |
| MailerLite | 100 | 100 | 100 | 100 | 100 | 100 | 100 | 100 | 100 | 100 | 100 | 80 |
| Brevo | 85.7 | 100 | 100 | 100 | 100 | 0 | 100 | 80 | 100 | 0 | 0 | 50 |
| Mailjet | Not tested | Not tested | Not tested | 100 | 100 | 57 | 94 | 94 | 66 | 77 | 46 | 100 |
| CleverReach | Not tested | Not tested | Not tested | 17.1 | 100 | 94.3 | 100 | 89 | 91 | 80 | 40 | 90 |
| HubSpot | Not tested | Not tested | Not tested | Not tested | Not tested | Not tested | 83 | 100 | 100 | 100 | 97 | 100 |
| Moosend | Not tested | Not tested | Not tested | Not tested | Not tested | Not tested | 100 | 97 | 100 | 100 | 100 | 100 |
| Omnisend | Not tested | Not tested | Not tested | Not tested | Not tested | Not tested | 100 | 100 | 100 | 97 | 100 | 100 |
| Sendpulse | Not tested | Not tested | Not tested | Not tested | Not tested | Not tested | Not tested | Not tested | Not tested | Not tested | Not tested | 40 |
What does this mean? Well, if you have a good sense of who your subscribers’ email providers are (in an ideal world for email marketers, that would be Yahoo!), you might consider choosing a newsletter service based on this. Of course, that’s often difficult to know. Plus, as our results show, deliverability to ISPs can change over time.
It’s perhaps more useful to just keep an eye out for any red flags. For example, Microsoft has, in the past, applied more stringent filtering to inbound emails, and some newsletter services – such as Benchmark – still struggle to get through.
Gmail Promotions Tab vs Primary Inbox
Gmail is known for its stringent spam filtering rules (learn about the even stricter sending requirements coming into effect in 2024). While the newsletter services were generally able to deliver to Gmail mailboxes just fine, not all ended up in the Promotions tab. Nowadays, even emails that wouldn’t normally be considered ‘promotional’ are ending up in this folder.
Proportion of Gmail-delivered emails that ended up in Primary inbox.
| Provider | Aug 2017 % | Mar 2018 % | Jan 2019 % | Jul 2019 % | Feb 2020 % | Sep 2020 % | Mar 2021 % | Oct 2021 % | Apr 2022 % | Jan 2023 % | June 2023 % | Jan 2024 % |
|---|---|---|---|---|---|---|---|---|---|---|---|---|
| ActiveCampaign | 100 | 100 | 100 | 95 | 16 | 60 | 60 | 40 | 80 | 97 | 74 | 100 |
| Aweber | 100 | 100 | 40 | 64 | 81 | 19 | 37 | 18 | 22 | 72 | 95 | 81 |
| Benchmark | 80 | 100 | 0 | 6 | 14 | 26 | 20 | 0.17 | 0 | 0 | 23 | 86 |
| Brevo | 77 | 100 | 40 | 95 | 80 | 80 | 80 | 75 | 78 | 60 | 58 | 100 |
| CleverReach | – | – | – | 75 | 81.5 | 60 | 40 | 22 | 60 | 88 | 94 | 86 |
| Constant Contact | 80 | 100 | 100 | 75 | 3 | 60 | 60 | 40 | 40 | 58 | 58 | 100 |
| ConvertKit | 100 | 100 | 40 | 75 | 45 | 60 | 40 | 42 | 18 | 58 | 78 | – |
| Drip | 100 | 100 | – | 72 | 44 | 60 | 60 | 49 | 69 | 46 | 37 | 97 |
| GetResponse | 80 | 100 | 100 | 75 | 16 | 0 | 0 | 0 | 20 | 18 | 60 | 98 |
| Hubspot | – | – | – | – | – | – | 20 | 0 | 6 | 60 | 75 | 98.5 |
| Mailchimp | 0 | 0 | 40 | 75 | 69 | 40 | 40 | 40 | 42 | 58 | 75 | 100 |
| Mailerlite | 100 | 100 | 49 | 61 | 10 | 20 | 20 | 15 | 22 | 26 | 40 | 97 |
| Mailjet | – | – | – | 55 | 49 | 40 | 40 | 35 | 40 | 60 | 60 | 80 |
| Moosend | – | – | – | – | – | – | 60 | 60 | 60 | 62 | 0 | 100 |
| Omnisend | – | – | – | – | – | – | 60 | 60 | 60 | 78 | 40 | 94 |
| Sendpulse | – | – | – | – | – | – | – | – | – | – | – | 100 |
Why do my Mailchimp emails go to Promotions?
Many Mailchimp users ask why their emails are going to Promotions. You can see that Mailchimp's deliverability rates have fluctuated over the years and that this question was more pertinent between 2017-2019 when 100% were ending up in the Promotions folder. However, nowadays, the percentage of Mailchimp emails ending up in Promotions isn't wildly different from other email marketing providers.
There’s no telling why some providers get sorted to Promotions and others don’t, as Google’s complex sorting algorithm is kept tightly under wraps. Ending up in Promotions is less than ideal, as your email is likely to get lost in the flood of emails that often make their way to that tab. Then again, if your email really is promotional and your subscribers are used to accessing emails from that tab, it may not be a problem. Furthermore, your email would be better off landing here than in the spam folder.
However, we did notice that when we set up DMARC authentication for our January 2024 tests, emails were much less likely to go to the Promotions folder. It's hard to say whether this had any effect, although it's certainly advisable to have this kind of authentication set up – especially as providers like Gmail and Yahoo now have much stricter sending requirements.
Our email deliverability test methodology
Our tests looked at some of the most widely-used email service providers:
- ActiveCampaign
- AWeber
- Benchmark
- Brevo
- Constant Contact
- ConvertKit
- Drip
- GetResponse
- MailChimp
- MailerLite
- Mailjet
- CleverReach
- HubSpot
- Moosend
- Omnisend
- Sendpulse (Newest addition)
*We were unable to include ConverKit during this round to their limitations with setting up subdomains and DMARC.
Using Glockapps.com, we ran our first round of testing in August 2017. This round comprised of 5 separate tests conducted over several weeks. We wanted to make sure all conditions were equal, so in each test, we:
- Set up a sender subdomain for each of the tested tools
- Authenticated SPF, DKIM and DMARC for all ESP's.
- Used the same email (always text-based, sometimes with links, and sometimes without)
- Sent to the same seed list of approximately 80 email addresses (representing 28 ISPs worldwide, including Gmail, Outlook, AOL and Yahoo; weighted according to the popularity of the email service)
- Sent all emails within a half-hour period
Note that all of our tests are performed on shared IP addresses.
Over three thousand emails later, we finally had the results from our first testing round. And we found some pretty big differences in email deliverability rates between providers – ranging from 64 to 92 percent!
Happy with the comprehensive deliverability report we received from Glockapps, we repeated this very same test round in March 2018, and from July 2019 onwards, we included an HTML email as one of our tests. The latest email deliverability test we carried out was in January 2024 and we plan to conduct, on average, one every 6 months.
Factors that influence email deliverability
It's important to understand that achieving effective email deliverability goes beyond simply choosing an Email Service Provider (ESP). While the selection of the right ESP remains a critical factor, several other elements significantly influence the delivery rate of your emails.
Factors such as maintaining a clean and well-managed email list, establishing a positive sender reputation, and creating engaging and relevant email content are equally, if not more, vital contributors to deliverability. It's important to acknowledge that as the volume of emails sent increases, the impact of the ESP alone diminishes. Therefore, our reporting holds particular relevance for small to medium senders using shared IP addresses.
Therefore while a dependable ESP is a key component in deliverability testing, its effectiveness is enhanced and at times overshadowed by meticulous list management, the development of sender reputation, and the crafting of compelling email content.
Watch our Email Deliverability Best Practices video:

Why do some email marketing platforms perform so much better than others?
We’d love to know what the top performers' secret is – and we’re sure the other tools do too! What we do know is that the ISPs often have the last say on whether an email lands in an inbox if you are using a shared IP address. This means that they have to trust the mail server sending that email; in our case, that means the server used by the newsletter service.
If that same server also happens to be sending out emails for other clients that are considered ‘spammy’, the deliverability of your own emails could suffer. Newsletter services, therefore, make it a priority to maintain their server’s reputation. But some are clearly doing a better job of this than others.
Some email marketing services offer customers a dedicated IP address (rather than shared IP addresses), but these come at a high price, and are most likely not affordable for small businesses. In fact, a dedicated IP is not adapted for small senders (<3000 emails a day) and for irregular senders. You'll only need to consider opting for a dedicated IP address once you start sending over 3,000 emails a day / over 150K emails a month.
What does this mean for me?
With 50% of B2C users buying through marketing emails once a month, seeing your emails go undelivered could be costing you more than you thought and disrupting your whole email marketing strategy.
When choosing a newsletter service, there are obviously many factors to consider – price, features, usability, and so on. But with these results, we’ve hopefully made it easy for you to shortlist (or discard) a few based on potential email deliverability rates.
Note that we said ‘potential’ – there’s simply no way of knowing for sure how deliverability will play out for each business. Our test results can give you a general idea of what you can expect, and what things to look out for, but your own experience may be very different. If so, we’d certainly like to hear about it!
See more email deliverability statistics!
How to improve email deliverability
In spite of our best efforts to establish the same testing conditions for each tool, it’s true that other factors can play an important role. We have put together a complete guide on email deliverability best practices, where you can find more detailed information on the points below:
Email Authentication
As the sender, you have a responsibility to do your best to increase email deliverability by authenticating emails using SPF, DKIM and DMARC and following best practice guidelines for creating and sending emails.
Usually, your newsletter tool will indicate whether all these records have been set up correctly. But you can also test your records with free tools like this SPF checker. We also have a handy little guide of how you can easily check SPF, DKIM and DMARC all at once.
Email Verification
For the sake of their deliverability, no email marketer wants their emails bouncing.
There are tools to validate that an email address exists and can receive emails, which can help to avoid bounces and protect your sender reputation.
However, you can keep on top of list hygiene even without an email checker by unsubscribing inactive emails from your list. Some email marketing tools are stricter than others and will remove inactive emails from your list for you if they bounce a certain number of times.
Content
Try to only send marketing emails people actually want to receive, i.e. only send to fully opted in lists. Sending emails to non-permission-based lists will result in low open rates, high unsubscribe rates, and high spam complaints, all of which indicate an unsuccessful email.
These kinds of results can have a negative effect on sender reputation and will impact future deliverability.
Frequency
Find the right balance between sending too many and too few marketing emails to your subscribers. Remember that people are bombarded with tons of emails on a daily basis, so, in order to avoid inbox fatigue, only send what’s necessary.
You can even ask them to set the frequency at which they’d like to receive emails from you in their preferences. This can avoid spam complaints.
Monitoring activity
It’s not a good idea to have inactive people on your list as, if you’re sending emails to them regularly, this can affect sender reputation and impact deliverability.
Make sure to regularly check in with the less active people and give them the opportunity to re-engage or opt-out of future emails.
Check out these mass email service providers that help businesses send mass emails via SMTP servers or API.
The authors
Learn more about us

We keep our content up to date
28 Feb 2024 - Updated our methodology section
21 Feb 2024 - Corrected January 2024 results due to a testing error, with increases in overall rates
31 Jan 2024 . Updated with January 2024 results
28 Aug 2023 - Added YouTube Video
24 Aug 2023 - Smaller updates and corrections
14 July 2023 - Updated Gmail primary inbox results
06 Jul 2023 - Infographic added
29 Jun 2023 - Updated with June 2023 results
10 May 2023 - Sendinblue is now called Brevo
27 Jan 2023 - Updated Sendinblue results
24 May 2022 - Added average deliverability of last 3 rounds section
Our Methodology
This article has been written and researched following our EmailTooltester methodology.
Our Methodology