
Report highlights. In 2026, approximately 392.5 billion emails will be sent each day. This number will continue to climb to 408.2 billion by the end of 2027.
- In 2024, 361.6 billion emails were sent per day.
- An estimated 376.4 billion emails will be sent per day in 2025.
- By 2027, 408.2 billion emails will be sent per day.
- This shows a compound annual growth rate (CAGR) of approximately 4%.
- Nearly 4.2 million emails were sent, worldwide, every second in 2024.
- The global email user base is forecast to grow to 4.7 billion by 2026 from 4 billion in 2020—a rise of approximately 600 million users.
Number of emails sent per day
Related reports include How many email users are there | Email marketing statistics | Cold email statistics | Spam email statistics | Email marketing ROI
Number of emails sent per day over time
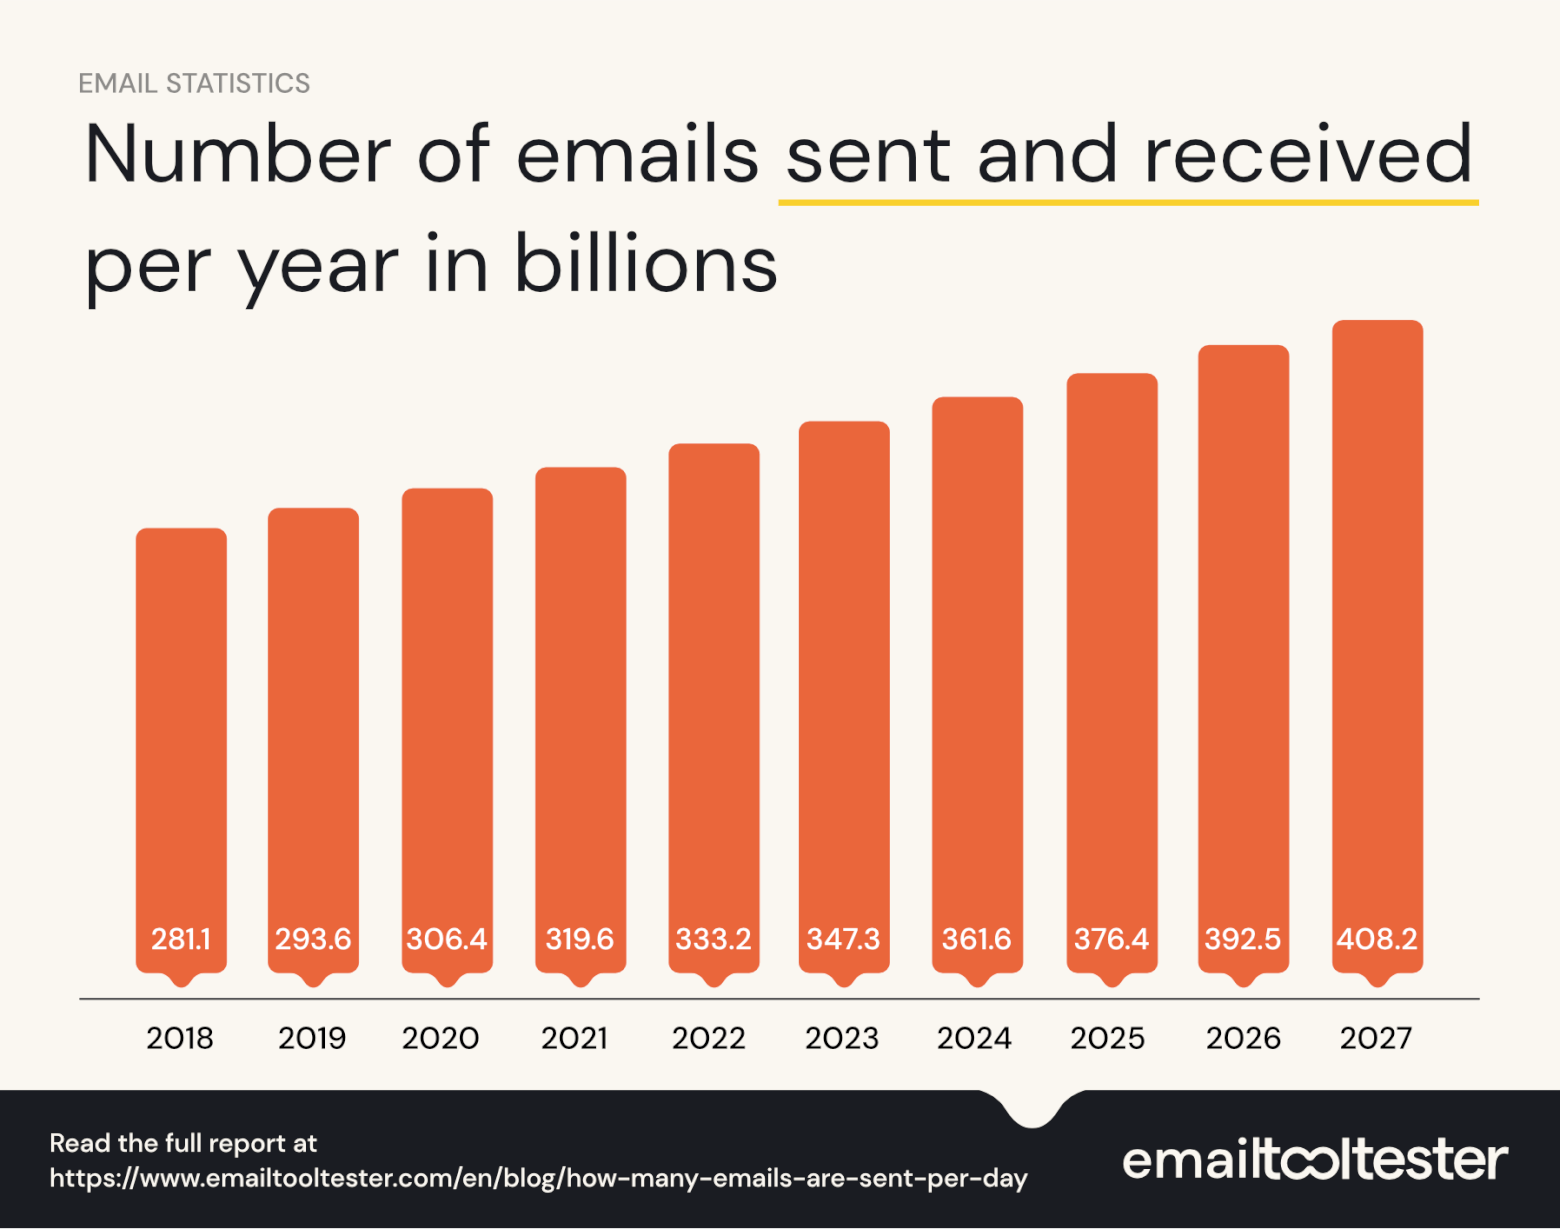
The number of emails sent per day has grown over the years. Below is a table showing the growth from 2018 to 2027.
| Year | Number of emails sent per day (in billions) |
|---|---|
| 2018 | 281.1 |
| 2019 | 293.6 |
| 2020 | 306.4 |
| 2021 | 319.6 |
| 2022 | 333.2 |
| 2023 | 347.3 |
| 2024 | 361.6 |
| 2025 | 376.4* |
| 2026 | 392.5* |
| 2027 | 408.2* |
* projected numbers
Number of emails sent per day by country
The number of emails sent per day varies by country. Of the top ten countries, the United States sent the most (9.7 billion) and Australia sent the least (8.1 billion).
- The US sends nearly 10 billion emails per day (the most of any country), followed by Germany and Ireland, which each send around 8.5 billion emails per day.
- The UK sends 8.3 billion emails per day (tied for fourth place with the Netherlands and France).
- Austria, Japan, and India each send 8.2 billion emails per day.
- Australia sends 8.1 billion emails per day, the lowest among the top ten.
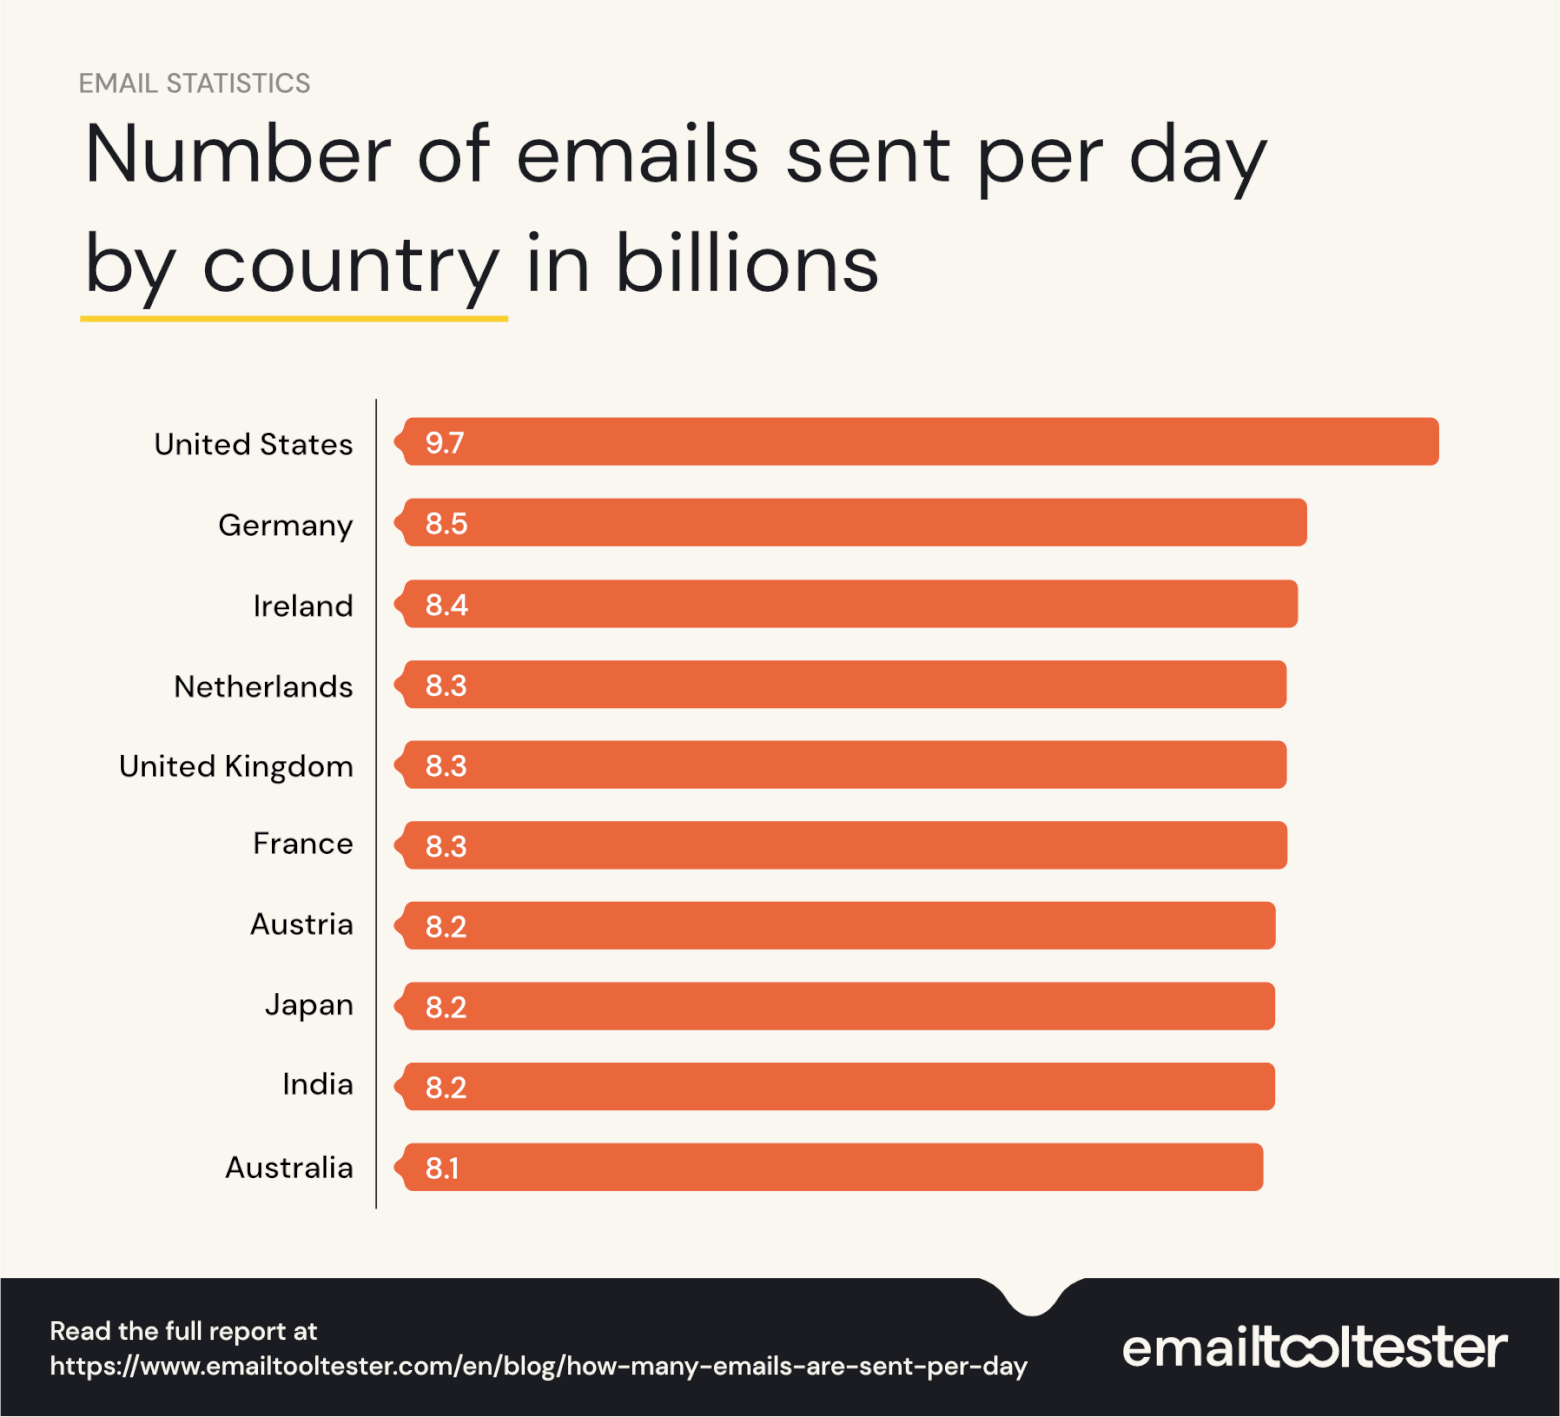
Emails sent per day by country, 2024
Number of emails sent per day by device
While mobile devices are the preferred device for checking email, at 54%, the overall preference differs by generation.
Numbers of emails sent by desktop and laptop
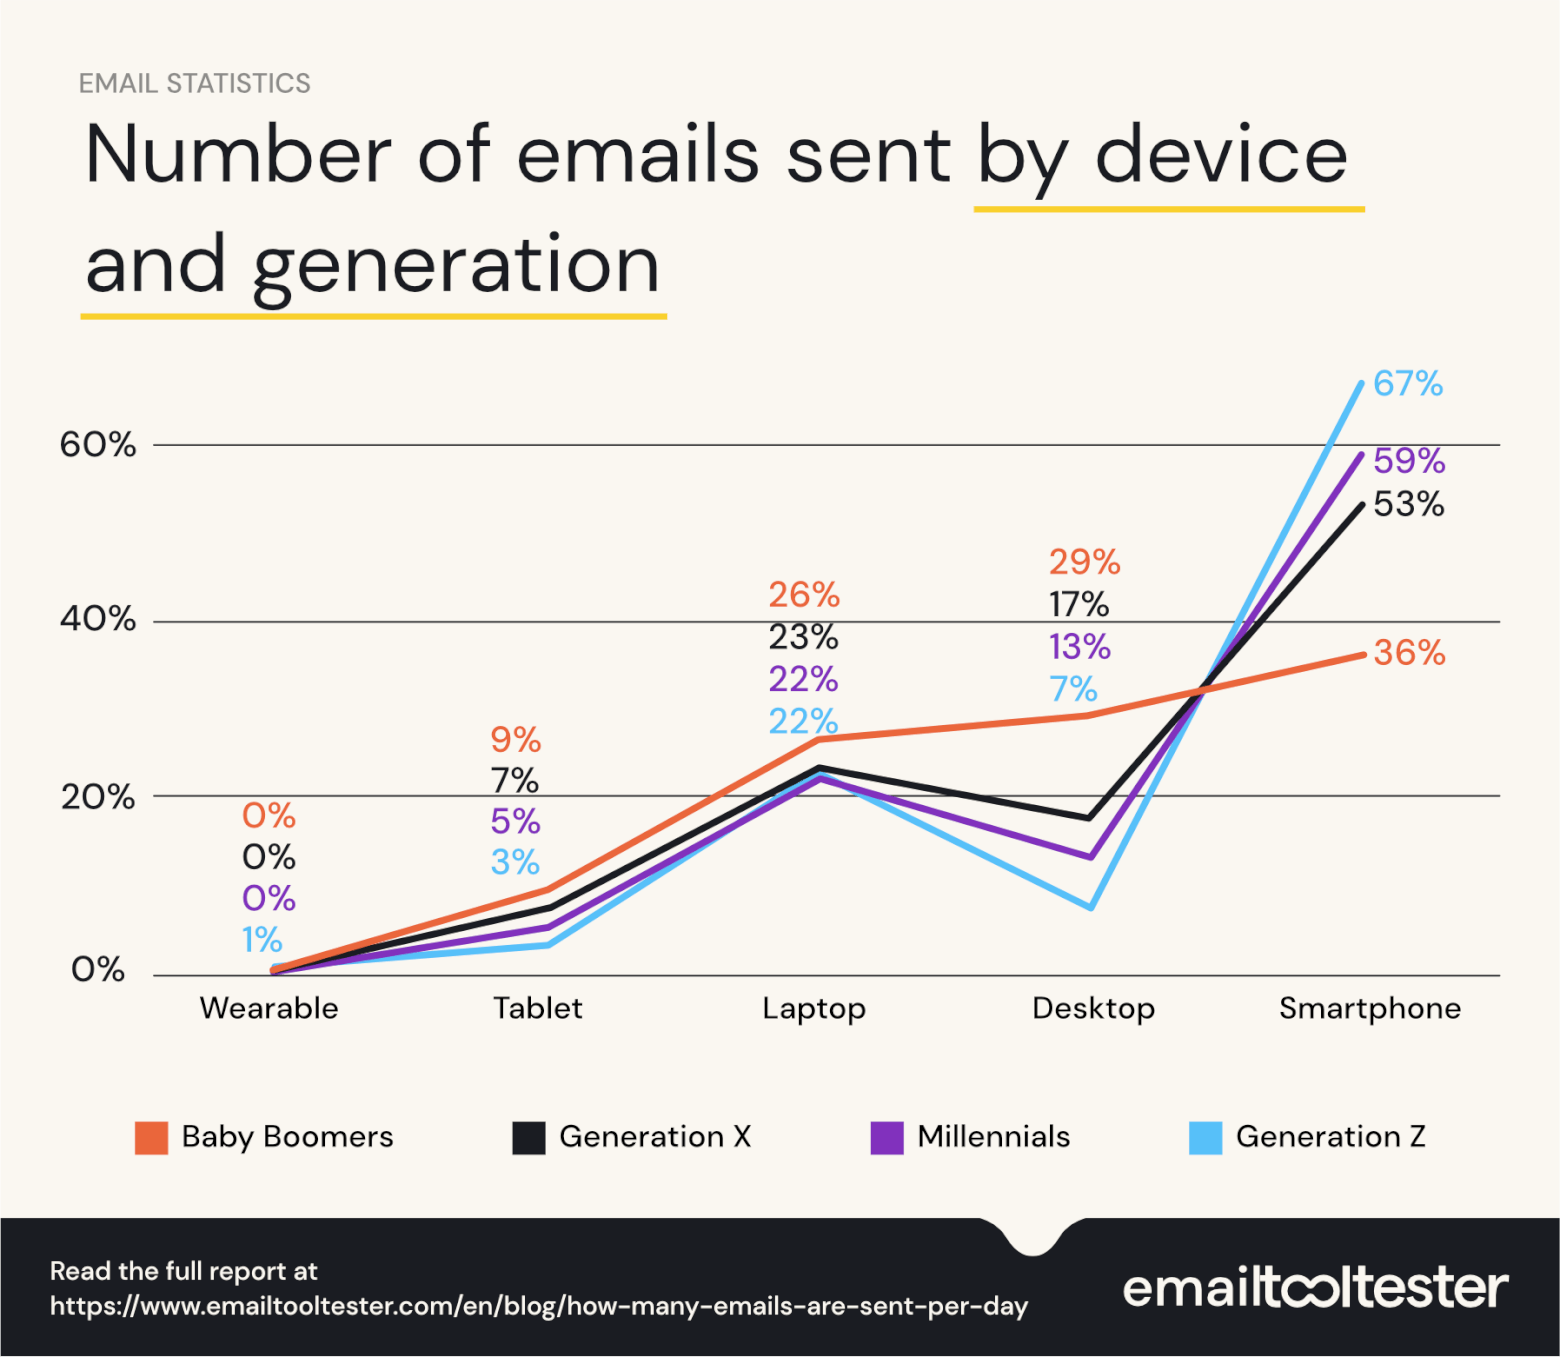
- While 29% of baby boomers prefer desktop for checking emails, this number falls to 17% for Gen X, 13% for millennials, and only 7% for Gen Z.
- A preference for checking emails on laptop is largely even across generations, at 26% for boomers, 23% for Gen X, and 22% for both millennials and Gen Z.
Number of emails sent by mobile device
- 54% of people primarily access their email using a mobile device, such as a phone or tablet.
- Among mobile devices, 81% of total users prefer reading emails on their smartphones, while 21% choose to do so on tablets.
- Around 1.7 billion people use their mobile phones to send and receive emails.
- 75% of users said they’re likely to delete emails that aren’t optimized for viewing on mobile devices.
- Gen Z leads other generations in use of smartphones for sending email, at more than two-thirds (67%).
- 59% of millennials prefer smartphones for checking email, compared to 53% for Gen X and 36% for baby boomers.
- Tablets are the least preferred device for checking email at only 9% for boomers and 7% for Gen X.
- Millennials and Gen Z are the least likely to use a tablet to check email, at 5% for millennials and only 3% for Gen Z.
How many email users are there?
For more detailed research, read our report on how many email users there are.
- The global email user base is forecast to grow to 4.7 billion by 2026 (about 57% of the global population and 83% of active internet users).
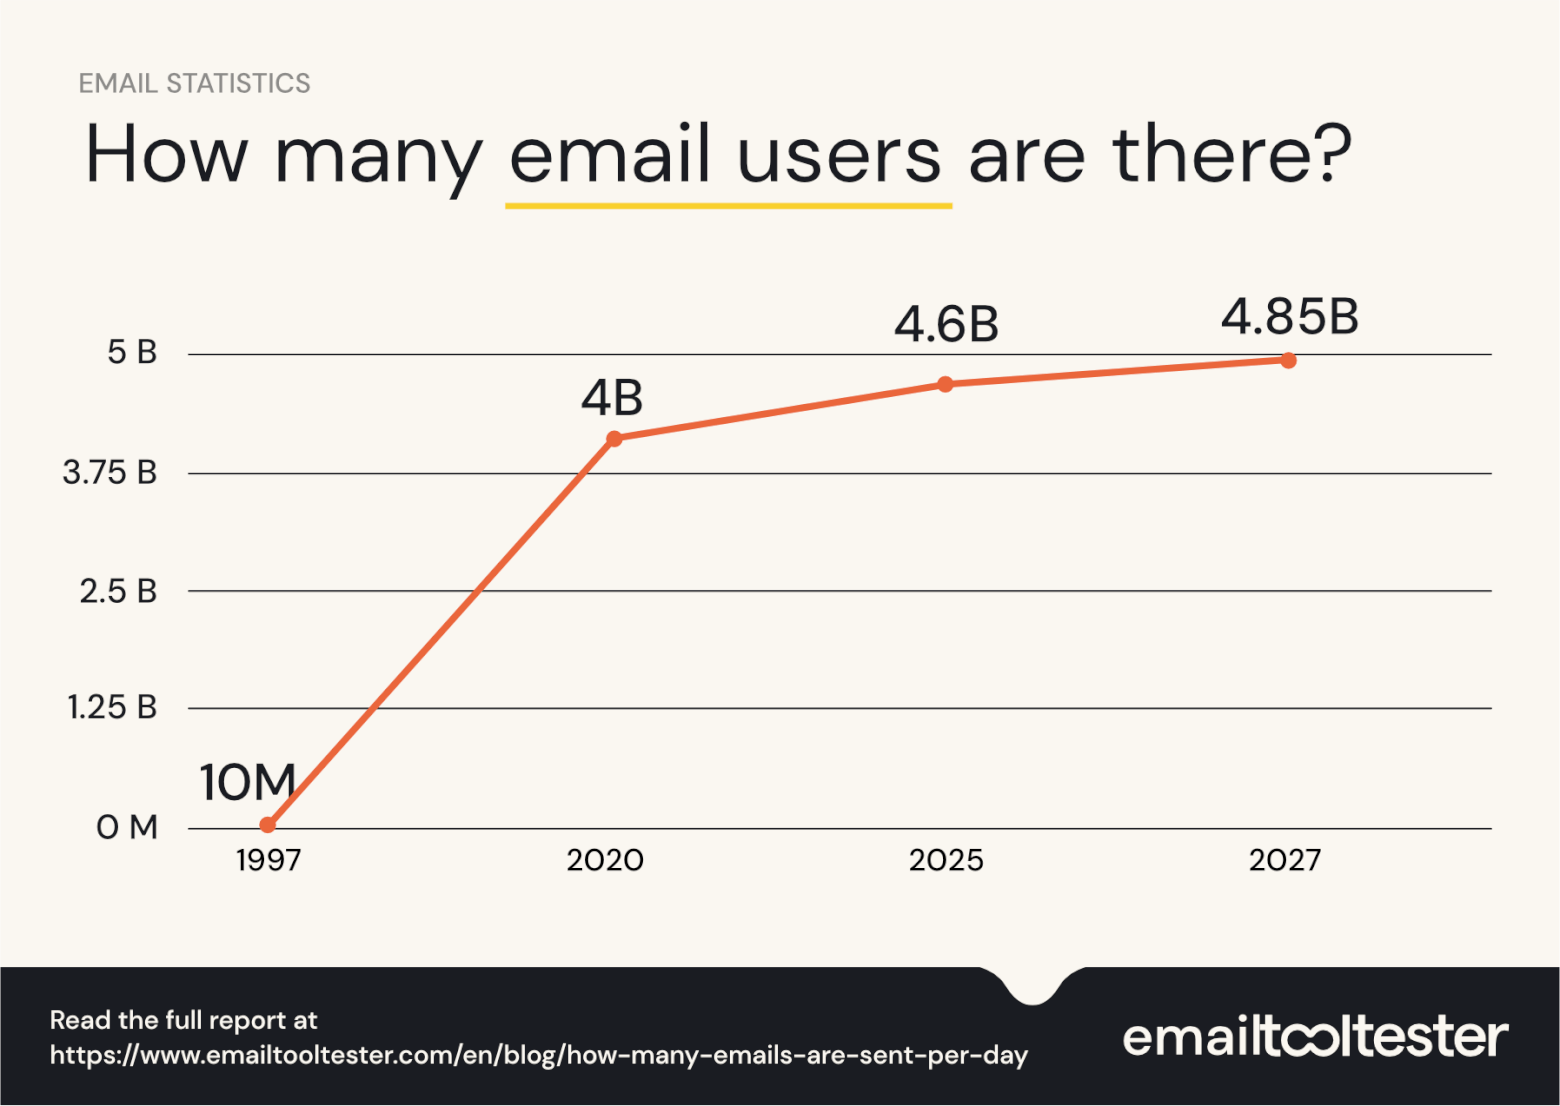
- The number of email users was 4 billion in 2020.
- Back in 1997, nearly 10 million people used email globally, which was just 0.17% of the world’s population (approximately 5.91 billion) at the time.
- By 2027, the number of email users is expected to grow to 4.85 billion. This represents a CAGR of about 23% from 1997 to 2027.
- On average, each email user has 1.86 email accounts. When this is applied to the global number of email users, it suggests there are approximately 8.3 billion email accounts worldwide.
- 58% of people check their email first thing in the morning, ahead of activities like browsing search engines, social media, or the news.
- 93% of people access or use email daily.
- 42% of users access email 3–5 times per day.
- 79% of people check emails for work purposes, while 41% do so for messages from family and friends or to explore brand discounts.
- A majority of users (67%) say they prefer shorter emails, while the length does not matter for 27% of users as long as the content is relevant.
- 95% of US adults aged 25 to 44 use email, compared to 86.5% of those aged 65 and older.
How many spam emails are sent per day?
For more detailed research, read our report on spam email statistics.
- In 2023, 160 billion spam emails were sent each day, accounting for 46% of the 347 billion daily emails exchanged.
- Only 152 billion spam emails were sent each day in 2017, but they made up 56.6% of the 269 billion emails exchanged daily back then.
- 96.8% of people report receiving spam messages of any kind (email, calls, or text messages).
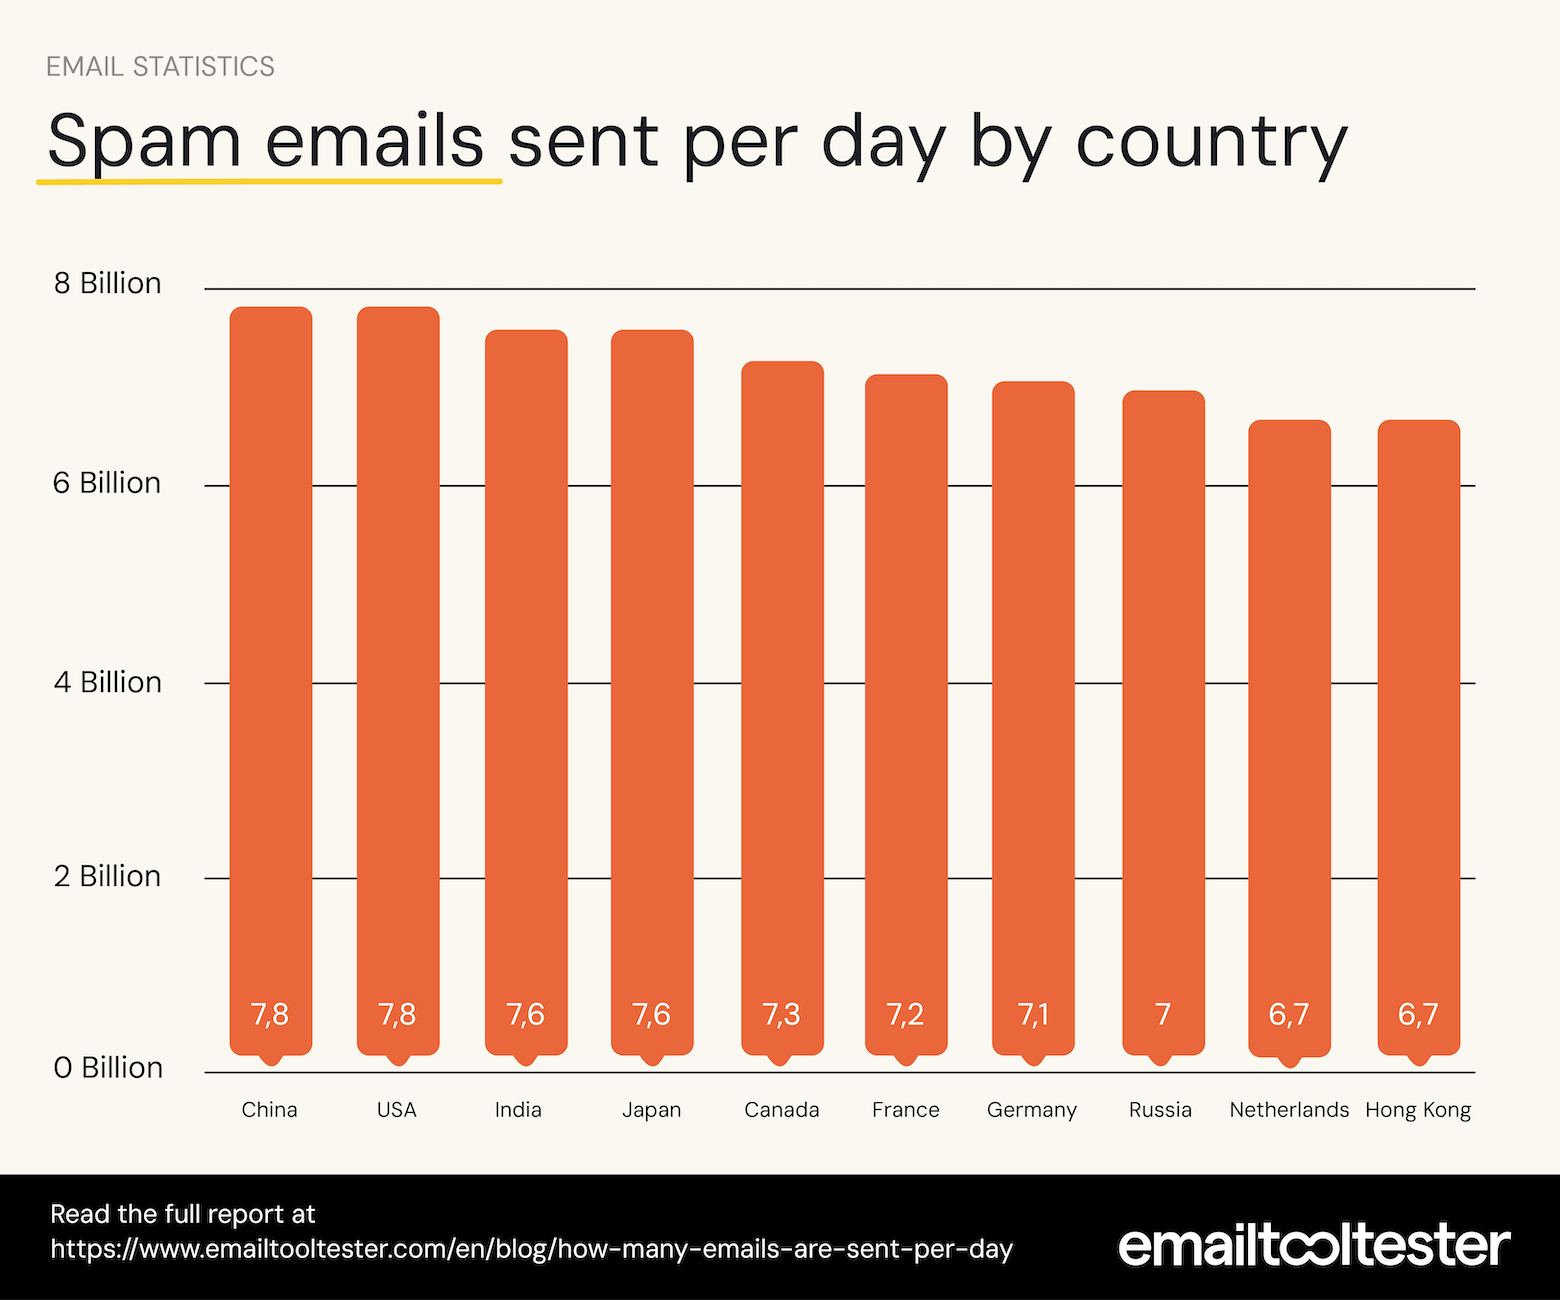
- China and the US send the highest number of spam emails, each at 7.8 billion per day, followed by India and Japan, which each send 7.6 billion per day.
- Considering that each spam mail produces 0.03 grams of carbon emissions, China and the US generate 234 metric tonnes of carbon emissions from spam messages alone every day.
- About 36% of people said that they received spam emails related to prizes and giveaways or job opportunities, followed by banking (34%), password or account updates (28%), and new software (23%).
- 73.3% of people believe spam filters are effective at keeping spam emails out of their inboxes.
- 43% of users who unsubscribe from emails report the reason as too many emails from the sender.
How many emails land in spam per day?
For more detailed research, read our report on email deliverability statistics.
- 10.5% of emails end up in the recipient's spam folder.
- 6.4% of emails go missing and are reported as “undelivered.”
- 80% of users said they mark an email as spam if it “looks like spam.”
- 55% of users said they mark unsolicited emails as spam.
- 76% of people check their spam folder, and 38% check it every week, while 25% check it a few times a year.
- In terms of leading email service providers, Google has the highest deliverability rate at 95.5%, followed by Microsoft (91.3%) and Yahoo (81.3%).
- 83% was the average deliverability rate across 15 email marketing service providers in 2024.
Top email providers: users, volume, and reach
The number of emails handled per day varies widely by email service provider (ESP), but Gmail alone handles over 120 billion emails daily and Apple Mail leads in open rates.
Gmail
- Gmail sees around 121 billion emails exchanged every day.
- There are more than 2.5 billion active Gmail users, representing about 30.9% of the global population.
- Gmail blocks over 15 billion spam emails each day.
- By 2025, Gmail is projected to hold a 35% market share, sending an estimated 131 billion emails each day.
Microsoft Outlook
- Outlook has over 400 million active users globally.
- Outlook has the third largest market share at around 8.2% of the email service provider market.
Apple Mail
- Apple Mail leads the email service market with a near 50% market share.
- According to Rejoiner data, over 55 million emails were opened in Apple Mail in 2022, accounting for over 70% of total email opens.
Which is the best day and time to send marketing emails?
Studies show that timing can significantly impact performance, and Friday and evening hours often lead to higher open and conversion rates.
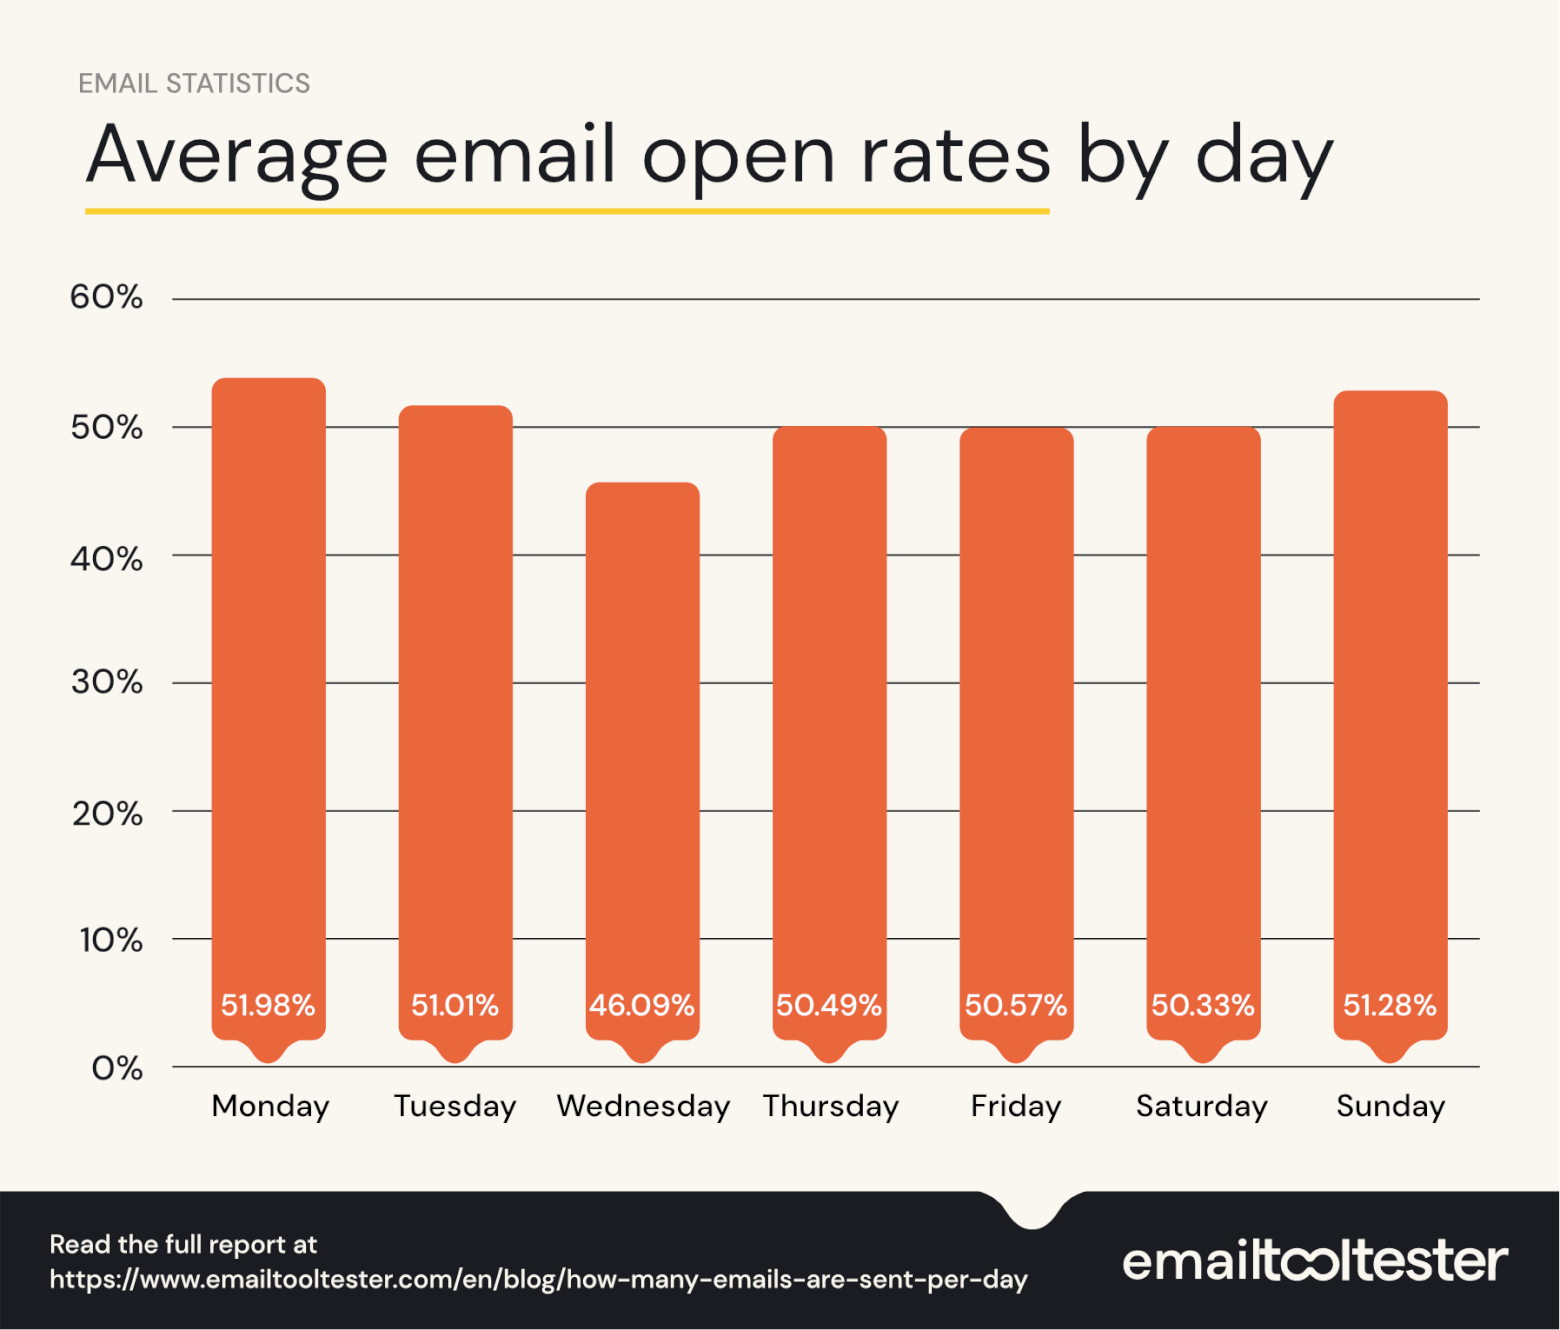
- According to a MailerLite study, Monday sees the highest average open rates, at 51.90%, followed closely by Sunday (51.28%, though this is a percentage of fewer emails) and Tuesday (51.01%).
- Wednesday sees the lowest open rates at 46.09%.
- According to an Omnisend study, emails sent on Friday have the highest click-through rate (CTR), at 13.58%, followed closely by Sunday (13.57%) and Wednesday (13.36%).
- Emails sent on Monday offer the lowest CTR, at 13.07%.
- Friday is also the best day for sending emails to get maximum conversion (5.74%), followed by Thursday (5.34%), Sunday (5.33%), and Monday (5.32%).
- Emails sent at 8 p.m. offer the best open rates, at 59.46%, followed by 2 p.m. (45.39%) and 11 p.m. (40.66%).
- Emails sent on the 2nd and 26th day of the month see the highest CTR at 14.33%, followed by the 7th (14.30%) and 6th (14.24%).
- The first day of the month sees the highest conversion rate (5.52%), followed by 30th and 20th.
Sources
- Number of sent and received emails per day worldwide from 2018 to 2027 – Statista
- Number of email users worldwide from 2018 to 2027 – Statista
- Daily number of emails sent worldwide as of April 2024 by country – Statista
- Email statistics report for 2025 – ZeroBounce
- Do millennials use email differently than other generations – Bluecore
- Email trends report: mobile vs. desktop – Campaign Monitor
- 100 compelling email statistics for 2025 – Porch Group Media
- Constant Contact and Chadwick Martin Bailey study
- Number of internet and social media users worldwide as of February 2025 – Statista
- Email usage statistics 2025: Latest reports and data – EmailTooltester
- Is email marketing dead? The surprising truth revealed! – OptinMonster
- Percentage of internet users in the United States who use email as of November 2023, by age group – Statista
- Spam statistics 2025: New data on junk email, AI scams & phishing – EmailTooltester
- Daily number of spam emails sent worldwide as of December 2024, by country – Statista
- Email deliverability statistics 2025: All the data on avoiding the spam folder – EmailTooltester
- Gmail user statistics: Fresh data for early 2025 – Clean Email
- Outlook user statistics: Fresh insights for 2025 – Clean Email
- The state of email client market share – Litmus
- Email client market share & Apple MPP statistics [2023 update] – Rejoiner
- The numbers are in. The best time to send email newsletters in 2025 is… – MailerLite
- The best time to send an email (2024 research) – Omnisend
The authors
Learn more about us

We keep our content up to date
09 Jan 2026 - Updated with 2026 numbers
Our Methodology
This article has been written and researched following our EmailTooltester methodology.
Our Methodology