
Update: Please find our latest deliverability test results from Jan 2024 here.
This is the fifth email deliverability test we’ve carried out, and it’s just as fascinating as our previous round.
If you’re not familiar with our tests, this is something we started doing back in August 2017 in order to monitor the deliverability rates of the world’s most popular email marketing services. The providers we’ve looked at have increased slightly since then – this round we included a total of 12 different email marketing services.
In a nutshell, 5 separate tests are carried out over the course of 5 weeks, using the delivery testing tool Glockapps. You can read more about our methodology here.
So, What is Email Deliverability?
Before we get into dissecting the results, I wanted to clarify a couple of things.
Principally, these two terms: email delivery and email deliverability.
Email delivery is when an email is successfully delivered to the receiving server (how to calculate email delivery rate).
Email deliverability is when an email successfully arrives in the person’s inbox.
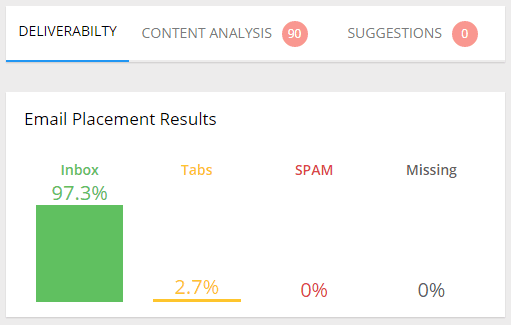
Just because your email was delivered, does not mean that it made it into the right place, i.e. the reader’s main inbox. There are, in fact, a number of places your email can go:
- the spam/junk folder;
- in the case of Gmail, the Promotions tab;
- or, worst of all, it doesn’t get delivered at all
The term ‘email deliverability’ covers all the above scenarios.
So, are you ready for the results?!
Note: Deliverability was calculated based on the percentage of emails that successfully reached recipients’ mailboxes – regardless of whether they landed in the main inbox or a secondary tab (e.g. Gmail Promotions).
Feel free to use this infographic on your own website. Just mention EmailTooltester as the source. Here you find the full-size version.
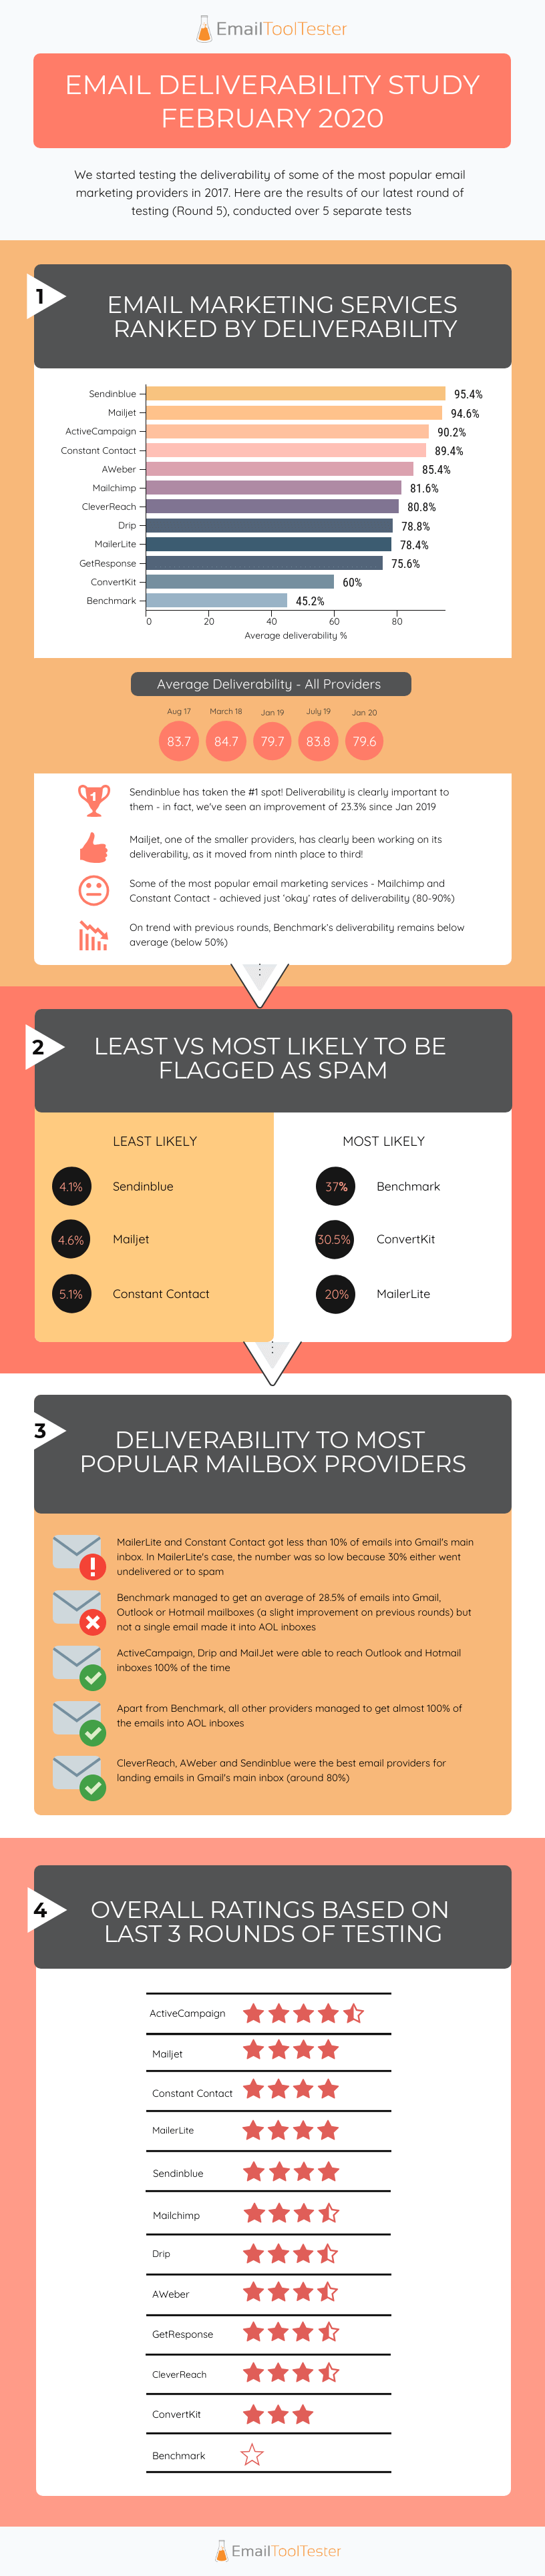
Email Deliverability Rankings: Takeaways
- Brevo – who, last round, took our ‘Most Improved Deliverability’ award – has shot up to first place with 95.4%!
- Mailjet, one of the smaller providers, has clearly been working on its deliverability, as it moved from ninth place to second!
- MailerLite and Kit really surprised us this round. MailerLite went from first to ninth place and Kit went from third to eleventh place
- Kit was the only provider to not land a single email in Microsoft mailboxes
- Unsurprisingly, Benchmark continues to perform badly, with just 45.2%
- It’s also worth noting that Mailchimp, arguably the most well-known provider, can’t manage to move out of the ‘okay’ bracket (80-90%)
Where Did The Emails End up?
The table below shows the averages for where emails ended up for each provider: the main inbox, another tab, the spam folder, or if they went missing.
| TOOL | MAIN INBOX % | TABS % | SPAM % | MISSING % |
|---|---|---|---|---|
| Brevo | 89.4 | 6 | 4.1 | 0.6 |
| Mailjet | 80.5 | 14.1 | 4.6 | 0.8 |
| ActiveCampaign | 74.8 | 15.5 | 7.3 | 2.5 |
| Constant Contact | 68.3 | 21.1 | 5.1 | 5.6 |
| AWeber | 81 | 4.3 | 13.4 | 1.3 |
| Mailchimp | 78.9 | 2.7 | 16.8 | 1.7 |
| CleverReach | 77.9 | 3 | 16.2 | 3 |
| Drip | 73 | 6 | 13.2 | 7.8 |
| MailerLite | 62.7 | 15.7 | 20 | 1.7 |
| GetResponse | 61.9 | 13.8 | 18.7 | 5.7 |
| Kit | 52.1 | 8.1 | 30.5 | 9.4 |
| Benchmark | 37.3 | 8 | 37 | 17.6 |
- The providers least likely to have emails end up in spam were Brevo (4%), Mailjet (4.6%) and Constant Contact (5.1%)
- The providers most likely to be flagged as spam were Benchmark (37%), Kit (30.5%) and MailerLite (20%)
Deliverability to Most Popular Mailbox Providers
There are tons of mailbox providers out there, and while our tests were sent to over 30 different ISPs internationally, we couldn’t record them all. Instead, they were weighted according to importance. The following table summarizes the average deliverability rates to Gmail, Yahoo, Microsoft (Hotmail + Outlook) and AOL. For Gmail, we’ve differentiated between the emails that arrived in the main inbox and the Promotions tab.
| TOOL | GMAIL INBOX % | GMAIL PROMOTIONS % | YAHOO % | MICROSOFT % | AOL % |
|---|---|---|---|---|---|
| Brevo | 80 | 12.9 | 82 | 98.5 | 100 |
| Mailjet | 48.6 | 42.9 | 100 | 100 | 100 |
| ActiveCampaign | 15.7 | 60 | 90 | 100 | 97.1 |
| Constant Contact | 2.9 | 91.4 | 100 | 98.5 | 100 |
| AWeber | 81.2 | 0 | 100 | 60 | 100 |
| Mailchimp | 68.6 | 0 | 100 | 80 | 100 |
| CleverReach | 81.5 | 0 | 87.5 | 63.1 | 100 |
| Drip | 44.3 | 20 | 100 | 100 | 85.7 |
| MailerLite | 9.6 | 60 | 100 | 32.3 | 100 |
| GetResponse | 15.7 | 52.1 | 100 | 56.9 | 100 |
| Kit | 45.4 | 34.3 | 97.5 | 0 | 97.1 |
| Benchmark | 13.6 | 20 | 7.5 | 23.1 | 0 |
- The providers most likely to end up in Gmail’s main inbox were CleverReach (81.5%), AWeber (81.2%) and Brevo (80%)
- The providers most likely to end up in Gmail’s Promotions tab were Constant Contact (91.4%), ActiveCampaign (60%) and MailerLite (60%)
- Compared to the last round of testing, most providers found it much more difficult to land their emails in Gmail’s main inbox. ActiveCampaign, for example, went from 94.7% in July 2019 to 15.7%
- ActiveCampaign, Drip and Mailjet were able to reach Outlook and Hotmail inboxes 100% of the time
- Kit (0%), Benchmark (23.1%) and MailerLite (32.3%) found it particularly difficult to get their emails into Outlook and Hotmail inboxes
Overall Ratings Based on Historical Performance
Just because a tool hasn’t performed quite so well this round, doesn’t mean they don’t have a good deliverability track record. Here, we’ve assigned a star rating to each provider, based on their overall performance over the last 3 rounds of testing. You can also see whether they’ve improved or deteriorated in performance since the last round.
| TOOL | STAR RATING | CHANGE SINCE LAST ROUND |
|---|---|---|
| ActiveCampaign | → | |
| Mailjet | ↑ | |
| Constant Contact | → | |
| MailerLite | ↓ | |
| Brevo | ↑ | |
| Mailchimp | → | |
| Drip | ↓ | |
| AWeber | ↑ | |
| GetResponse | ↓ | |
| CleverReach | ↓ | |
| Kit | ↓ | |
| Benchmark | → |
Brevo takes our number one spot, as well as our ‘Best deliverability’ award. 
Mailjet wins our ‘Most improved’ award for deliverability, with a 9.8% improvement since last round (July 2019).
![]()
How Does This Affect my Email Marketing Strategy?
With deliverability rates of our tested tools ranging from 45 to 95%, you can basically double or halve the success rate of your campaign by using the right (or wrong!) tool.
When you’re choosing a provider, make sure that it has good delivery rates – we’d recommend referring to our historical data to see the upward or downward trends of each tool. You can also do your own tests with Glockapps or a similar deliverability testing platform – here is a sample report.
Email Deliverability Test: Conclusion
Though I hope that you’ve found this deliverability test to be useful, I recommend that you use it as a reference alongside your own research.
Make the most of free plans and trial periods and use a deliverability tool to run tests on any tool you try out.
Keep an eye out for our next round (results released mid-2020) to find out if Brevo can keep the top spot and whether ActiveCampaign and MailerLite can make a come back. We’re also intrigued to see how Mailjet performs after seeing such good results this round.
Noticed any deliverability issues with your email marketing service? Or have any questions? Let us know in the comments below!
The authors
Learn more about us

Our Methodology
This article has been written and researched following our EmailTooltester methodology.
Our Methodology