Update: Please find our latest deliverability test results from Jan 2024 here.
Following on from our previous email deliverability test last year, we’re pleased to release the results of our latest round of testing.
There were a few surprises this round – the third in our series of deliverability tests (we launched the first round in August 2017). One tool saw a remarkable improvement, for example, and other more widely-used tools performed not so great.
We're running these tests as part of our ongoing commitment to monitor the deliverability rates of the world’s most popular email marketing services. As with previous rounds, we tested 10 different email marketing services in five separate tests, using the delivery testing tool Glockapps (you can read more about our methodology here).
But enough with the spoilers! Check out our infographic below, followed by a more detailed breakdown of the results.
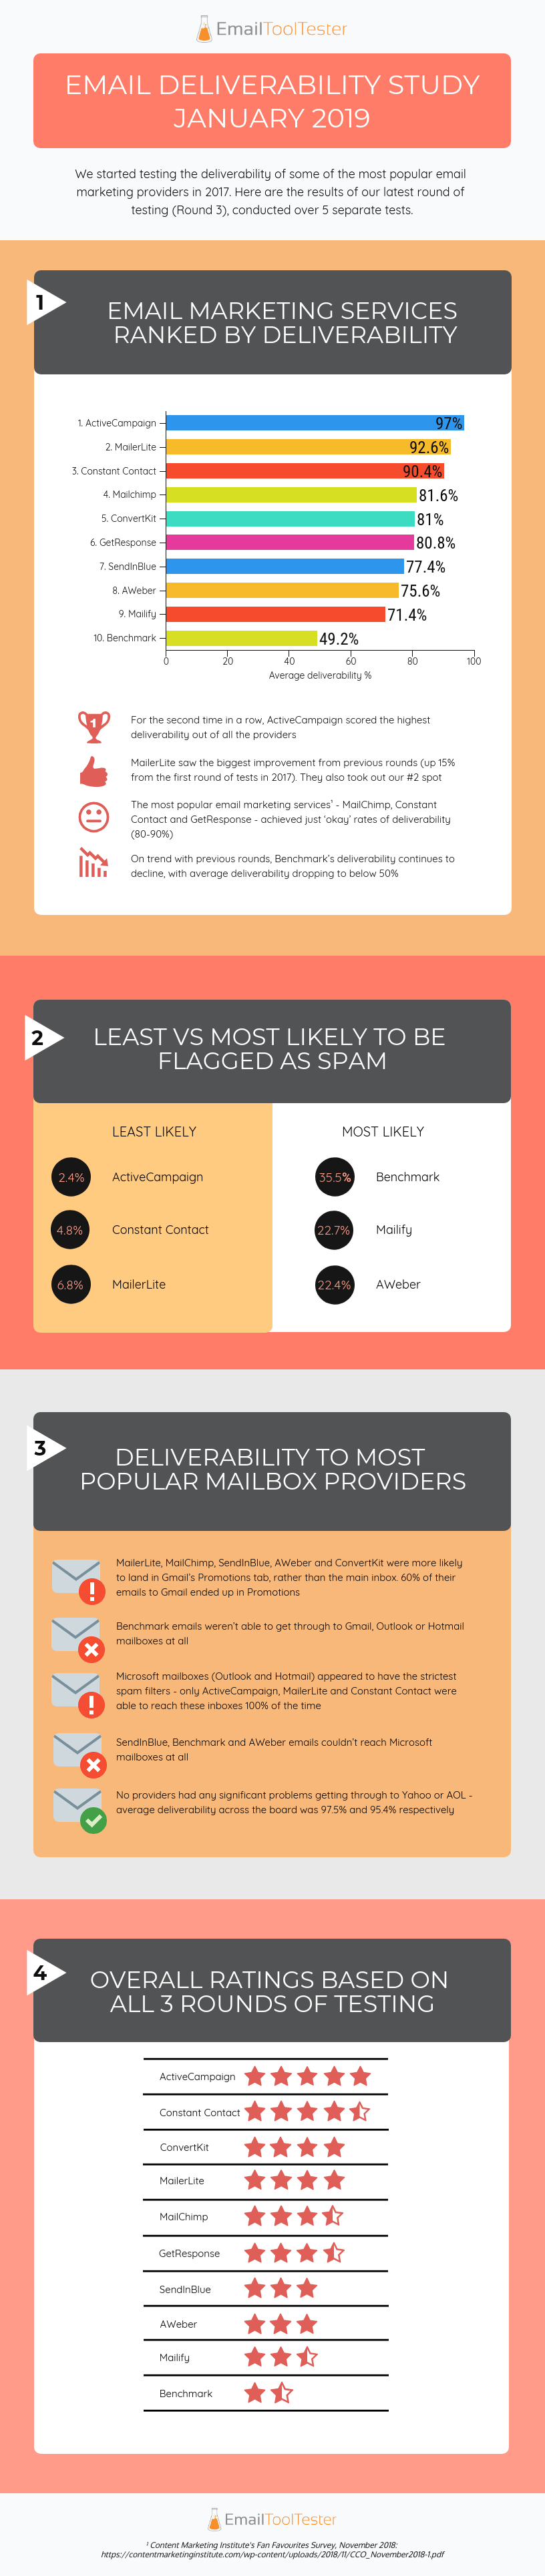
Email deliverability rankings: Key takeaways
- Deliverability was calculated based on the percentage of emails that successfully reached recipients’ mailboxes – regardless of whether they landed in the main inbox, or a secondary tab (e.g. Gmail Promotions)
- ActiveCampaign continues to have the highest rates of email deliverability, scoring their highest average rate ever (97%)
- MailerLite has seen a huge improvement in deliverability rates, claiming the #2 spot. After recent issues with blacklisting and deliverability, improving deliverability rates is clearly a high priority for them. They recently introduced stricter approvals processes, which seems to already be having a positive impact on deliverability
- Benchmark have continued to drop significantly, with average deliverability at an all-time low of 49.2%. It’s disappointing for a tool that we rate so well in most other aspects
- It’s interesting to note that the most popular email marketing services – Mailchimp, Constant Contact, GetResponse – scored just ‘okay’ rates of deliverability (between 80-90%)
- Curiously, we found that a high Sender Score (as established by Return Path) didn’t always translate to high deliverability rates (as was the case with Benchmark, who had an average sender score of 97.6). However, lower sender scores generally resulted in lower deliverability – we saw this with Brevo, Mailify and Kit
Where did the emails end up?
The table below shows the averages for where emails ended up for each provider – the main inbox, another tab, the spam folder, or if they went missing.
| Tool | Main Inbox % | Tabs % | Spam % | Missing % |
|---|---|---|---|---|
| Active Campaign | 95.4 | 1.4 | 2.4 | 0.8 |
| Constant Contact | 84.7 | 5.8 | 4.8 | 4.7 |
| Get Response | 78.6 | 2.5 | 16.5 | 2.4 |
| MailerLite | 78.3 | 14.3 | 6.8 | 0.6 |
| Kit | 68 | 13.1 | 13.7 | 5.2 |
| Mailchimp | 63.6 | 18.1 | 17.8 | 0.6 |
| Mailify | 61.5 | 9.6 | 22.7 | 6.2 |
| Brevo | 58.9 | 18.4 | 21.3 | 1.1 |
| Aweber | 57.2 | 18.3 | 22.4 | 2 |
| Benchmark | 46 | 3.1 | 35.5 | 15.4 |
- Emails that didn’t get delivered ended up either in spam folders, or went missing before they could reach recipients’ mailboxes
- The providers least likely to have emails end up in spam were ActiveCampaign (2.4%), Constant Contact (4.8%) and MailerLite (6.8%)
- The providers most likely to be flagged as spam were Benchmark (35.5%), Mailify (22.7%) and AWeber (22.4%)
Deliverability to most popular mailbox providers
While our tests were sent to over 30 different mailbox providers internationally, they were weighted according to importance. The following table summarizes the average deliverability rates to the main ISPs – Gmail, Yahoo, Microsoft (Hotmail + Outlook) and AOL. For Gmail, we’ve differentiated between the emails that arrived in Gmail’s main inbox and Gmail’s Promotions tab.
| Tool | Gmail Inbox % | Gmail Promotions % | Yahoo % | Microsoft % | AOL % |
|---|---|---|---|---|---|
| Active Campaign | 100 | 0 | 100 | 100 | 100 |
| Get Response | 100 | 0 | 100 | 20 | 100 |
| Constant Contact | 100 | 0 | 100 | 100 | 100 |
| MailerLite | 40 | 60 | 100 | 100 | 100 |
| Mailchimp | 40 | 60 | 100 | 31 | 100 |
| Brevo | 40 | 60 | 97.5 | 0 | 100 |
| Aweber | 40 | 60 | 100 | 0 | 80 |
| Mailify | 40 | 40 | 80 | 15 | 74.3 |
| Kit | 40 | 60 | 97.5 | 75 | 100 |
| Benchmark | 0 | 0 | 100 | 0 | 100 |
*Microsoft figures recalculated in May 2019 to reflect weighting of Outlook vs Hotmail
- The providers most likely to end up in Gmail’s Promotions tab (instead of the main inbox) were MailerLite, Mailchimp, Brevo, AWeber and Kit. Each had an average of 60% of their emails arrive in the Promo tab. This is less than ideal, as emails in Promotions have a lower chance of being read
- For Mailchimp, however, this is a big improvement – previously, they landed in Gmail Promotions 100% of the time
- Benchmark wasn’t able to get through to Gmail, Outlook and Hotmail at all. This is a huge drop in performance, as in previous rounds, they struggled with Outlook and Hotmail only
- Providers had most difficulty getting through to Microsoft inboxes (Outlook + Hotmail). Only ActiveCampaign, MailerLite and Constant Contact were able to get through 100% of the time. Brevo, Benchmark and Aweber couldn’t get in at all
Overall ratings based on historical performance
Here, we’ve assigned a star rating to each provider, based on their overall performance over the three rounds of testing. You can also see whether they’ve improved or deteriorated in performance since the last round.
| Tool | Star rating | Change since last round |
|---|---|---|
| ActiveCampaign | ↑ | |
| Constant Contact | ↓ | |
| Kit | ↓ | |
| MailerLite | ↑ | |
| Mailchimp | ↓ | |
| GetResponse | ↑ | |
| Brevo | ↑ | |
| AWeber | ↓ | |
| Mailify | New | |
| Benchmark | ↓ |

ActiveCampaign takes out our number one spot, as well as our ‘Best deliverability’ award, for consistently high deliverability rates across each of our testing rounds.

MailerLite wins our ‘Most improved’ award for deliverability, with a 15% improvement from the first round.
What does this mean for my email marketing strategy?
Email deliverability rates are a feature that’s often overlooked when choosing an email marketing service – perhaps because it’s so difficult to get this information.
There’s no denying, though, that they can have a huge impact on campaign success. With deliverability rates of our tested tools ranging from 49 to 97%, you can literally double or halve the success rate of your campaign by using the right (or wrong!) tool.
We acknowledge that email deliverability isn’t an exact science – rates fluctuate over time (as we saw this round with MailerLite), and despite our best efforts to establish the same testing conditions for each tool, we know that not everyone will have the same experience. After all, there are many factors that influence deliverability, many of which are the responsibility of the sender.
How to improve my own deliverability?
So what can you do? We suggest taking these figures as a rough guideline. If you’re on the market for a new email marketing service, make sure you do your research. Choose a provider with a reliable track record and, if possible, find out about the kinds of processes they have in place for approving new customers, list uploads, email sends etc. And take advantage of free plans or trial periods to really test the tool’s deliverability out (using tools like Glockapps – click here to see a sample report from them).
Worried about where your current tool is sitting on our list? Do everything in your power to increase your chances of getting your email delivered (authenticating emails, following best practice guidelines for creating and sending emails). Pay close attention your campaigns’ send, open and click-through rates, and run further tests through Glockapps or a similar deliverability tool. If you’re really concerned, you can always trial out another tool for sending your campaigns and compare the results.
We’d really like to see the low-performing tools prioritize email deliverability in 2019. Email marketing services may have their differences in features and design, but this is the one feature you shouldn’t have to shop around for.
[We have since released the results of our July 2019 email deliverability test, see how they compare.]
Noticed any deliverability issues with your email marketing service? Or have any questions? Let us know in the comments below!
The authors
Learn more about us

Our Methodology
This article has been written and researched following our EmailTooltester methodology.
Our Methodology