
Key email marketing statistics are important to know if you work in the industry. They can help shape your email marketing strategy, for example, realizing the importance of optimizing your email campaigns for smartphone users or discovering that the average email open rate isn’t actually that far off your own.
Email marketing is paramount to any online business and should be a key pillar in your digital marketing strategy.
Let me tell you why:
I got my first email address when I was around 12 years old. I used to love AOL’s encouraging “you’ve got mail” greeting, though my inbox was fairly vacant back then.
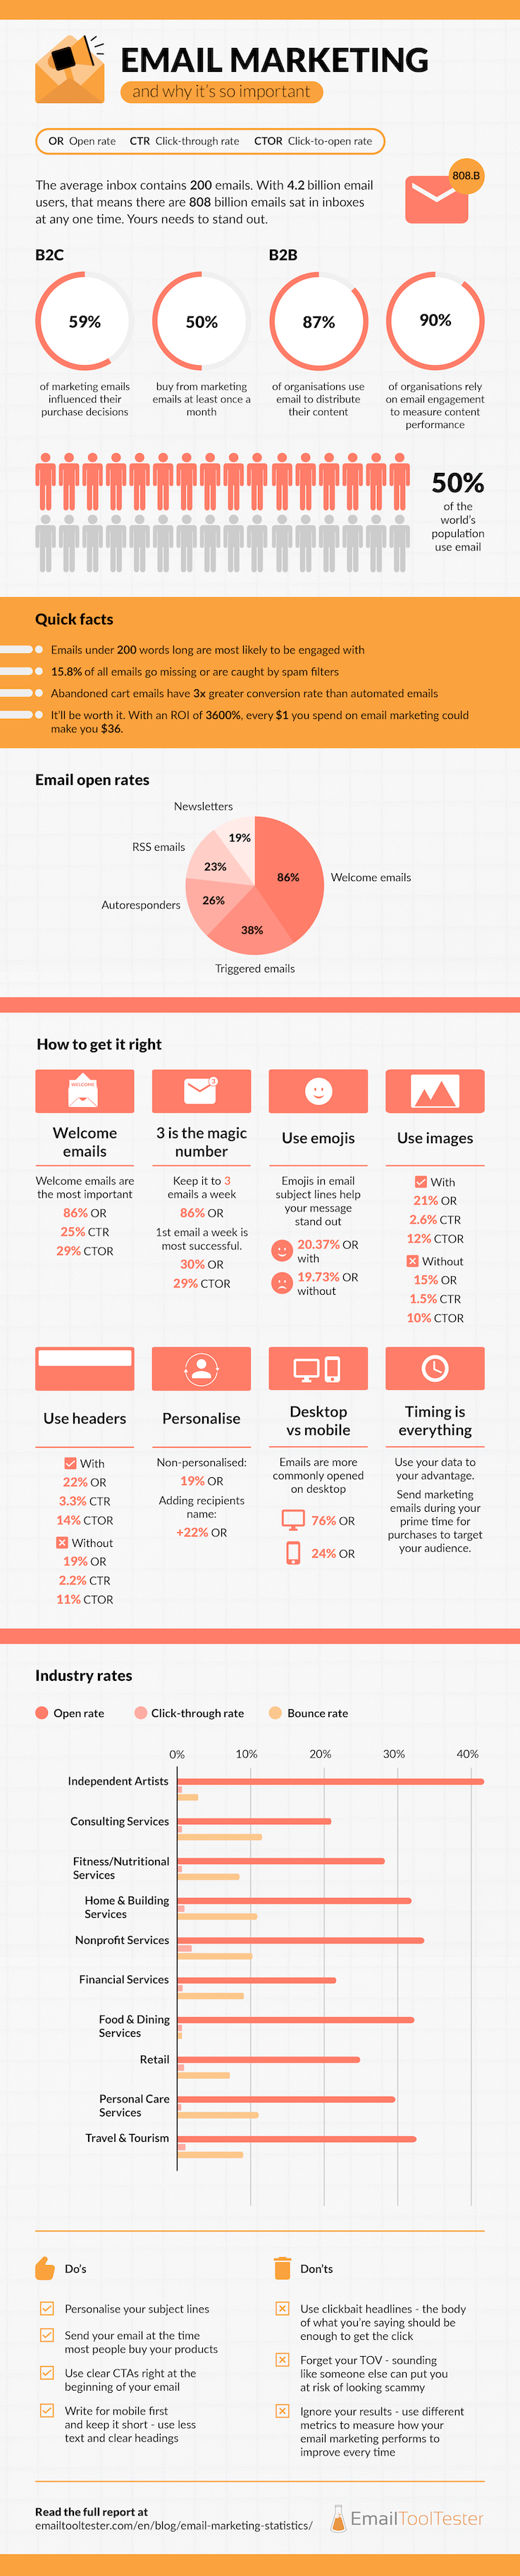
Flash forward to 2022 and though I’ve been through 3 different personal email addresses (plus a ton for various places of employment and education), I am still an avid email user – just like 50% of the world’s population. That’s right, there are currently 4.2 billion email users in the world, making it a great way to promote your products and services!
Though marketing strategies have included many tactics over the years (flyers, TV advertisements, cold calling, social media, video marketing, Facebook ads, SEO-optimized content, etc.), one thing is clear: email marketing remains one of the most important tools for businesses in 2023, and it’s likely to remain that way over the coming years.
This complete guide details the latest email marketing statistics and also includes a few tips to help you get the most out of this powerful tool.
Email Marketing Stats: Summary
- 50% of the world’s population use email
- Email is the most commonly used workplace communication tool
- Email marketing has an ROI of 3600%
- Approximately 376 billion emails will be sent and received in 2025
- Welcome emails have an open rate of 63+%
- Email deliverability averages at 81%
- Abandoned cart emails convert 3x more than other automated emails
- 43.5% of all emails are opened on mobile devices
- Most email users read their emails on Apple readers
As you can see, email marketing is not something you want to overlook. If you’re looking for the right tool to help you get started, we’d recommend taking a look at our detailed comparison of these popular platforms.
Email Marketing and why it's so Important
Further down you can find our top tips on how to get better conversion rates and work on customer retention, but first, here are the all-important email marketing statistics in one handy infographic:
Find all sources at: emailtooltester.com/resources/email-marketing-statistics
Email Usage Worldwide

First, some general email marketing statistics.
As I mentioned above, 4.2 billion people currently use email, and that number is set to grow to 4.6 billion users in 2025.
So what does that look like in emails? In 2022, 333 billion emails were sent and received each day. The figure is expected to increase to 376.4 billion emails sent every day in 2025.
You might say “that means people must be receiving a hell of a lot of spam”, and you’d be right. 49% of those emails were spam, amounting to 162 billion spam emails sent every day!
Despite this fact, marketing emails are continuing to engage people and lead to purchases of products and services across all industries. You only have to look at the ROI for email marketing, which continues to grow.
Email Marketing ROI

One of the most important email marketing stats: email marketing ROI (return on investment).
When you only have a limited marketing budget, you need to be sure that the marketing strategy you employ is going to be profitable. Many marketers will test a variety of tactics before investing a large chunk of the funds into whatever works. Of course, every business’s strategy will be different, but one thing is for sure: email marketing will give you results!
The first email blast was sent in 1978, and it generated the company $13 million in sales. Pretty impressive, right? Though things have changed quite a bit since the seventies, with companies having to compete a lot harder for their customer’s attention (and their cash), the return on investment for email marketing is still sky-high.
Email marketing ROI is now calculated at 3500%. That’s $36 for every dollar you spend on your email campaign. And the best thing is, you can start building your contact list and sending them emails for free!
So when people ask “Is email marketing dead?”, the answer is a resounding no.
Email Open Rate Statistics

Open rate is one of the most important metrics in email marketing. This measures the percentage of your subscribers that actually opened an email that you sent them.
What is the average email marketing open rate in 2023?
The average email marketing open rate in 2023 is 26.76%. This is the mean of the average open rates reported in 2023 by Campaign Monitor, Mailchimp, Constant Contact, Hupspot, Mailmodo and Get Response.
In comparison, open rates for cold email outreach are between 40% and 60% according to our own survey.
What is the average newsletter open rate?
The average newsletter open rate in 2022 was 27.9% according to email marketing platform GetResponse. This was almost 1.5x higher than the 19.3% open rate of the previous year. Such a big increase is probably related to Apple MPP (see below).
On average, newsletters should have a 15-25% open rate, though this depends on the health of your list, subject lines, and even the industry you operate in (more on that below).
What is the average email open rate by type in 2023?
GetResponse, found the following average email open rates by type in 2023:
- Welcome emails have an open rate of 63.91%
- Newsletters have an open rate of 27.9%
- Autoresponders have an open rate of 35.91%
- Triggered emails have an open rate of 35.33%
- RSS emails have an open rate of 44.54%
What is the average email open rate by industry?
The average email open rates by industry in 2023, according to Constant Contact:
| Industry | Open Rate | Click-through Rate | Bounce Rate |
|---|---|---|---|
| Faith-Based Organizations | 44.11% | 2.43% | 9.59% |
| Child Care Services | 43.87% | 1.84% | 8.46% |
| Independent Artists | 39.77% | 1.55% | 5.80% |
| Nonprofit Membership Organizations | 39.41% | 1.96% | 12.17% |
| Travel and Tourism | 39.15% | 0.96% | 7.27% |
| Recreation, Sports & Entertainment | 39.13% | 1.09% | 9.66% |
| Nonprofit Services | 39.13% | 1.62% | 10.78% |
| Education | 37.66% | 1.57% | 9.37% |
| Transportation Services | 37.66% | 0.69% | 11.26% |
| Family and Social Services | 37.14% | 1.52% | 9.47% |
| Food and Dining Services | 36.50% | 0.66% | 9.26% |
| Home & Building Services | 35.18% | 1.22% | 10.53% |
| Personal Care Services | 35.03% | 0.70% | 11.38% |
| Health and Wellness | 34.87% | 0.91% | 10.12% |
| Legal Services | 32.84% | 1.28% | 15.69% |
| Real Estate | 32.79% | 0.84% | 13.00% |
| Retail | 31.83% | 0.93% | 7.61% |
| Repair and Maintenance | 29.34% | 0.86% | 6.23% |
| Administrative & Business Support Services | 28.44% | 1.81% | 11.16% |
| Financial Services | 27.76% | 1.01% | 9.58% |
| Consulting Services | 27.48% | 1.18% | 9.83% |
| Manufacturing and Distribution | 26.54% | 1.24% | 14.83% |
| Technology Services | 18.34% | 2.67% | 10.08% |
You might expect the open and click rates to have a tight correlation, but not necessarily. Each email should have a clear call-to-action for the reader. If you succeed in doing this, you will benefit from higher click rates.
Tip: A button usually helps. So how can you increase open rate, and what can you do to ensure people read, click and convert?
Email Personalization Statistics
Does personalization of the subject line improve email open rate?
Yes, the data shows that personalization does improve email open rates. While emails with non-personalized subject lines were opened by 19.57% of recipients, adding the customer’s name saw open rates increase to 20.66%.
Does personalization of the subject line improve email CTR and CTOR?
Yes. Click-through-rate (CTR) was also slightly higher – 2.62% in emails with personlized subject lines compared to 2.33% in emails with generic subject lines.
And the difference between the click-to-open-rate (CTOR) was even more pronounced – 12.70% in emails with personlized subject lines compared to 11.92% in emails with generic subject lines.
Does personalization of the body copy improve email CTR and CTOR?
If you can use a customer’s name in the subject line, it makes sense to do it in the body copy too. Most small business email marketing services will allow you to add custom fields to both your subject line and body of the email.
31.93% of emails use personalized body copy. But does affect the CTR and CTOR is a positive way? Sort of…
The CTR is higher – 2.48% in emails use personalized body copy versus 2.33% in email that don't. But when you get to the CTOR, the improvements stop. Personalized body copy only sees a CTOR of 11.42%, compared to non-personalized emails that achieve a rate of 12.42%!
Email Subject Line Statistics
Do emojis in the subject line improve email open rate?
Yes, the data shows that using emojis in the subject line does improve email open rate slightly. While emails with subject lines that don't use emojis have an open rate of 19.73%, adding emojis saw open rates rise to 20.37%.
However, once the emails have been opened, they don’t seem to make a great deal of positive difference.
The CTR of emails with emojis in the subject line is only 2.35% versus 2.38% without. And the CTOR is even worse: 11.52% with emojis compared to 12.07% without.
It looks like an emoji can help get your email noticed, but you need to do more than that to get people to engage with it.
What's the ideal email subject line length?
It's crucial to consider the variety of devices and applications on which your email might be opened. The email subject line length that will be fully visible varies significantly between different devices and platforms.
For instance, Apple Mail on the iPhone 14 generously allows up to 48 characters, while the Gmail app on the Google Pixel 7 limits visibility to just 33 characters.
When considering email clients accessed via desktop browsers, Gmail has essentially no limit and will cut off the subject line where your screen ends, while Outlook does the same but typically cuts off around 51 characters on a standard-sized browser window.
Therefore, to ensure that your full subject line is visible on all devices and applications, it's advisable to put the main message inside the first 33 characters and not exceed 50 characters in total length.
Mobile Email Marketing Statistics

Do desktop emails have a higher open rate than mobile emails?
Yes, emails received on desktops have an average open rate of 75.55%, compared to an average open rate of 24.45% for emails recived on mobiles.
It makes sense when you think about why. If your customers are sitting at their desktop, they’re much more likely to be at work – a situation where they’ll regularly open emails and be active online.
If they receive the email on their mobile, chances are they’ve finished work for the day and are sat trying to enjoy themselves. Your email popping up midway through their favorite TV show is unlikely to be met with a warm reception.
What's the ideal length of an email?
Data suggests that emails under 200 words long are most likely to be engaged with.
Even though our data shows how emails are more likely to be opened on desktop, that doesn’t mean you should look to fill a desktop’s worth of space with content. Your customers are busy, they don’t have time to read huge chunks of text. If anything, they’ll skim your email to see if there’s anything worth looking at.
Writing for mobile forces you to use less text and clearer headings – both good practices for emails of any kind.
Make your headings easy to read and descriptive. Explain what the content below them is about, so if people are scrolling through, they can see it straight away.
Then keep your copy short.
Email Deliverability Statistics
Our email deliverability statistics come from our own bi-annual deliverability tests on the most popular email marketing platforms.
We found that email deliverability averages at 81%, meaning that 19% of all emails go missing or are caught by spam filters.
Of course, this is an average and some email platforms see a greater proportion of their emails getting lost in the mail. Of course, some providers perform consistently well; MailerLite has the best email deliverability of all the tools we’ve tested.
We’d recommend keeping an eye on deliverability rates and carrying out your own tests. You can also check out our complete guide to email deliverability best practices, for more detailed information on how to improve your email deliverability.
On average it takes 10 to 20 seconds for an email to arrive at one of the major inboxes. For real-time insight into actual inbox delivery speed, you can refer to Postmark's “Time to Inbox” dashboard.
It monitors the time from sending to delivery for transactional emails sent to leading inbox providers such as Gmail, Yahoo, Outlook/Hotmail, AOL and Apple Mail. By tracking the performance every five minutes, it gives senders a practical benchmark for what fast, reliable inbox timing really looks like.
Abandoned Cart Email Statistics
Abandoned cart emails make you money. Fact.
Klaviyo, an ecommerce platform, found that on average, abandoned cart emails have conversion rates that are 3x greater than other automated workflow emails.
In the analysis, they also found that approximately 3,000 customers recovered more than $60 million in abandoned cart revenue in just three months using an abandoned cart email series.
Omnisend’s report shows that abandoned cart messages saw the largest YoY increase (13%) in conversion rates of all non-transactional automated messages.
That’s pretty impressive, especially when you consider how little work it takes the marketer to set up. If you have an ecommerce this is something that you should be implementing yesterday! (You can check out our guide on the best abandoned cart templates for some inspiration.)
And make sure to check out our ecommerce email marketing statistics study.
Where are People Reading Their Emails?
Many people use software applications on their desktop, mobile or tablet to read, send and manage their email.
As of Oct 2020, popular desktop clients included Outlook and Apple Mail, and the most popular web-based email system was Gmail. Apple iPhone was the most popular reader used.
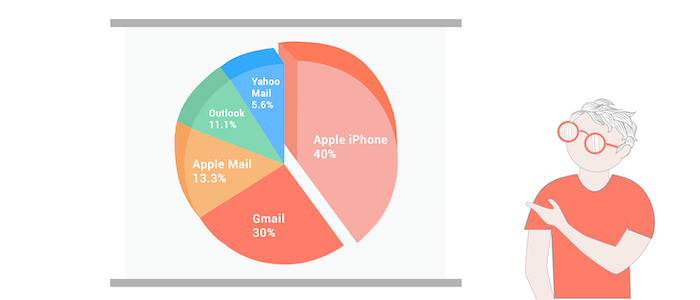
[Data supplied by Litmus Email Analytics, Oct, 2020]
In Sept 2021, Apple launched Mail Privacy Protection (MPP) with the release of iOS15. MPP “works by hiding your IP address and loading remote content privately in the background, even when you don’t open the message. This makes it harder for senders to follow your Mail activity.” – Apple.
Many people opted into MPP, meaning that as of March 2022, Apple’s market share now accounts for 60.66%.
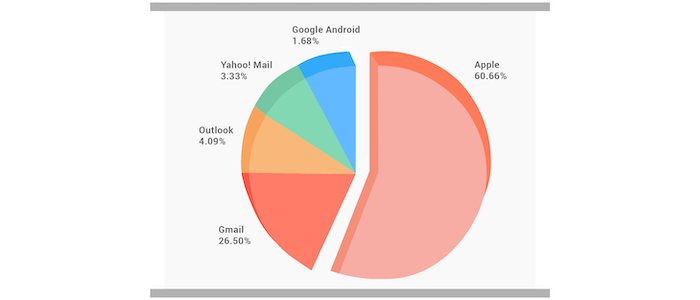
Some email marketing platforms take Apple MPP opens into account in their reporting, and several also allow you to preview your email design on a number of different email clients. I would bear the above figures in mind when doing so, whilst also checking it against your own data regarding your subscribers.
B2B Email Marketing Statistics
“B2B” stands for ‘business to business’ and refers to operations that are directed towards selling products and services directly to businesses.
- 85% of B2B organizations use email marketing software to assist with content marketing
- 81% of B2B organizations use email newsletters as part of their marketing strategy
- 87% of B2B organizations use email to distribute their content
- 90% of B2B organizations used email engagement as the top metric to measure content performance
[Data supplied by the Content Marketing Institute]
B2C Email Marketing Statistics
“B2C” stands for ‘business to consumer’ and concerns selling products through businesses directly to consumers.
- Ecommerce brands sent 75% more SMS in 2021 than in 2020, incorporating SMS into their sales funnels.
- Salecycle found that 59% of respondents said that marketing emails influenced their purchase decisions, while just over 50% buy from marketing emails at least once a month.
SMS Marketing Benchmarks
- Click rates for promotional SMS increased from 10.6% in 2020 to 11.5% in 2021, while automated SMS increased slightly from 11.8% to 12%.
- Automated SMS sent out between Black Friday and Cyber Monday generated 23% more orders.
[Source: Omnisend]
Based on these figures, we’d recommend incorporating SMS into your automated email workflows. ActiveCampaign, Brevo and Omnisend offer SMS marketing for an affordable price.
Our Top Tips For Email Conversion
There’s no way to guarantee everyone will engage with your emails. After all, not everyone will be looking for what you’re selling at that exact moment, and no matter how you pitch it, they just won’t be keen.
However, there are simple things you can do to give yourself a fighting chance.
Timing is Everything
Have you ever noticed how fast food emails hit your inbox at around 17:30 on a Friday? That’s no coincidence. The brands know that’s when you’re most likely to be thinking about treating yourself, so they make it easy by hitting you with a discount code and pictures of your favorite pizza. Email, opened.
Think about when you want to engage with your customers. When are they likely to want your product? When are they likely to be checking their emails? Chances are, their inbox will be full first thing in the morning. They’ll go through and clear anything out that doesn’t look important.
If your email lands later on in the day, seeing that little ‘1’ pop up in their inbox could be enough to grab their attention.
The research suggests that 21.49% of emails are opened within the first hour of them being received. Make sure yours has space to be seen.
Give Them a Reason to Read More
Your subject line is everything. If it’s boring, why should anyone read anything else? While personalization can help, an email that says, ‘Name, here’s our latest newsletter’ still isn’t going to get anyone’s heart racing.
Instead, target the subject line at their interests. Use your data to see what products they’ve been looking at, which deals they’ve been eyeing up, what buttons they’ve been clicking.
A subject line that says, ‘Hey Name, we’ve got an exclusive <product name> we think you’ll love’ is more likely to grab their attention. If it’s something they’re already looking for, they’ll appreciate you helping them find it.
Use pictures
Emails with images achieve open rates of 21%, compared to those without that achieve rates of 15%. Engagement is better too, with a CTOR of 12% v 10%. Images just make the email look more inviting. People are likely engaging with them during the working day or on mobile devices, meaning they don’t have time to read through tonnes of text. Text looks boring. It looks like hard work.
Adding relevant pictures in can break up the scroll and make your email marketing appear more professional.
Offer clear calls to action, often
The main point of any email marketing campaign is to get customers to click.
Make it as easy as possible for them to do just that.
Clear CTAs that stand out from the rest of your copy are easier to spot, no matter how fast someone is scrolling. Put one in the very first section of your email, so people don’t need to read anything to complete the action, then stick a second right at the end.
Break your content up
Headers and sub-headers are essential for readability. Long blocks of content aren’t appealing and are impossible to read while scrolling. Headers give people something to look out for, allowing them to quickly scan your email and absorb all the information relevant to them.
Emails with headers achieve CTORs of 14%, compared to those without, which only achieve 11%.
Avoid clickbait headlines
Open this email, you won’t believe what’s inside!
That might have worked once, but anyone who’s had an email inbox since the 90s will know it’s a trick of the trade. Clickbaity headlines like this risk annoying your audience, so unless they genuinely WON’T believe what’s inside (flying dog, Eiffel Tower made of cheese, etc.) don’t bother.
If the body of your email is interesting enough, mention it in the subject line. People can decide for themselves if it’s worth clicking.
Don’t forget your tone of voice
Emails are just another branch of your overall communications platform. If a customer reads an email and clicks through to a website that sounds nothing like it, they’ll be a little confused. At worst, they might think they’ve been scammed.
Write your emails just like you’d write anything else to ensure brand consistency.
Ready to start emailing?
We’ll help you create your own email newsletter to inform your audience of everything you’re up to. Use our tips above to ensure people don’t only read it, but they actually look forward to receiving it.
Looking for more tips and best practices? We have a whole guide on lead generation through email marketing – be sure to give it a read when setting out your marketing strategy.
Sources
Techjury, Statista, Content Marketing Institute, Salecycle, Blog HubSpot, Klaviyo, Campaign Monitor, GetResponse, Constant Contact, Omnisend.
See our full data sheet for more information on email marketing.
Are there any email marketing statistics you’d like to see featured in this article? Let us know in the comments below.
The authors
Learn more about us

We keep our content up to date
24 Nov 2025 - Time to Inbox stat added
27 Jul 2023 - Added information about subject line lengths
18 Jan 2023 - Updated deliverability average
04 May 2022 - General update of all email stats
06 Sep 2021 - Infographic updated (error correction)
09 Jun 2021 - General update. Added infographic
Our Methodology
This article has been written and researched following our EmailTooltester methodology.
Our Methodology