You’ve set up your latest campaign, and you’re chuffed with yourself.
But what next?
After you’ve finished your celebratory dance, it’s time to run the numbers. We’re talking email marketing KPIs (Key Performance Indicators)—a.k.a. the little nuggets of data that can provide powerful insights into the effectiveness of your email strategy.
Think of KPIs as your trusty compass that provide you with the information you need to gauge the success of your emails and make better decisions moving forward. When you track the right numbers you’re able to understand what’s working and what’s not and you’ll be able to answer questions like:
- Do people like it when I add emojis to the subject line?
- Am I making the message of my emails clear enough?
- Are my emails contributing to my business in any way?
…And many, many more.
From how many people hit the dreaded unsubscribe button to how much money you’re making from each email, these email marketing KPIs will tell you everything you need to know about the status of your email marketing efforts.
1. Deliverability rate
Deliverability rate shows you how many emails have been successfully delivered to your list. This means the emails have actually landed in inboxes and aren’t lost in the ether – that is, the spam or junk mail folder, or emails that didn’t get delivered at all. Therefore, the deliverability rate counts all emails that landed in inboxes, regardless of whether they ended up in the Primary, Promotions or Social tabs.
For example, you might have a 10,000-strong email list, but if 20% of your emails aren’t getting to recipients’ inboxes that means you might as well only have 8,000 people on your list. It’s a big drop.
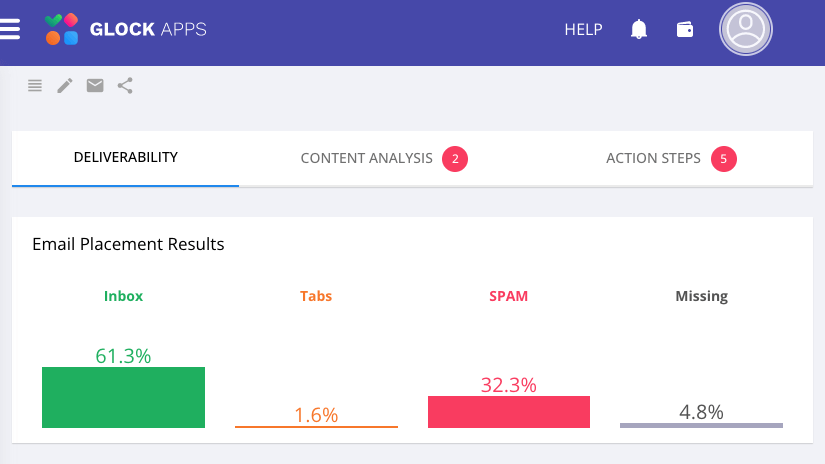
How Glock shows deliverability
If your deliverability rate is high, it’s a good sign that your email list is healthy and full of legit email addresses, and that your content is hitting the mark. If you start to see numbers dropping, it could indicate that your emails are getting blocked by spam filters, or that you’re getting an influx of spambot subscribers.
How to calculate deliverability rate: Divide how many emails have actually landed in subscribers’ inboxes (Primary, Promotions and Social tabs) by the total number of emails sent. Multiply by 100 for a percentage.
Getting this number is not that easy, unfortunately. You'll either need to run your own tests or use an email deliverability testing tool like Glock. This will tell you exactly where your newsletter ended up in a variety of international email providers (e.g. Gmail, Outlook, Yahoo etc.).
In an ideal world, your deliverability rates would be a squeaky clean 100%, but there are bound to be some outliers tucked away in your list. You should only start to worry if rates drop below 90%.
Note: Although they sound similar, deliverability rate isn’t exactly the same as the delivered rate, which includes all emails that get delivered, even those that ended up in the spam folder (because they technically have been delivered). In short, delivered rate looks at the total number of emails that haven’t bounced—which we talk about more a little further down below.
How to improve deliverability rates
- Use a double opt-in to minimize the chance of potential typos
- Audit how you collect your email addresses
- Regularly clean your email list
- Set subscriber expectations from the get-go
- Choosing an email marketing service (ESP) with a solid track record in deliverability (we’ve identified a few of the top performers in our email deliverability tests)
Real-world example: ActiveCampaign wins on deliverability rate
The ESP you choose can have a huge impact on your deliverability rate. We’ve been testing the deliverability of some of the most popular platforms over the past few years and our most recent test revealed some fun findings.
The average deliverability rate for all providers was 80%, with ActiveCampaign and Mailchimp claiming the top two spots with 93% and 92.7% deliverability rates respectively. Overall, we found that emails sent via Benchmark, GetResponse, and MailerLite were most likely to land in the Promotions tab.
2. Open rate
While your deliverability rate measures how many emails reach the right place, open rates show you how many people have actually opened your emails. And, if you know how many emails people receive every single day (spoiler: it’s a lot), you’ll know that it’s no easy feat to stand out and win that all-important open.
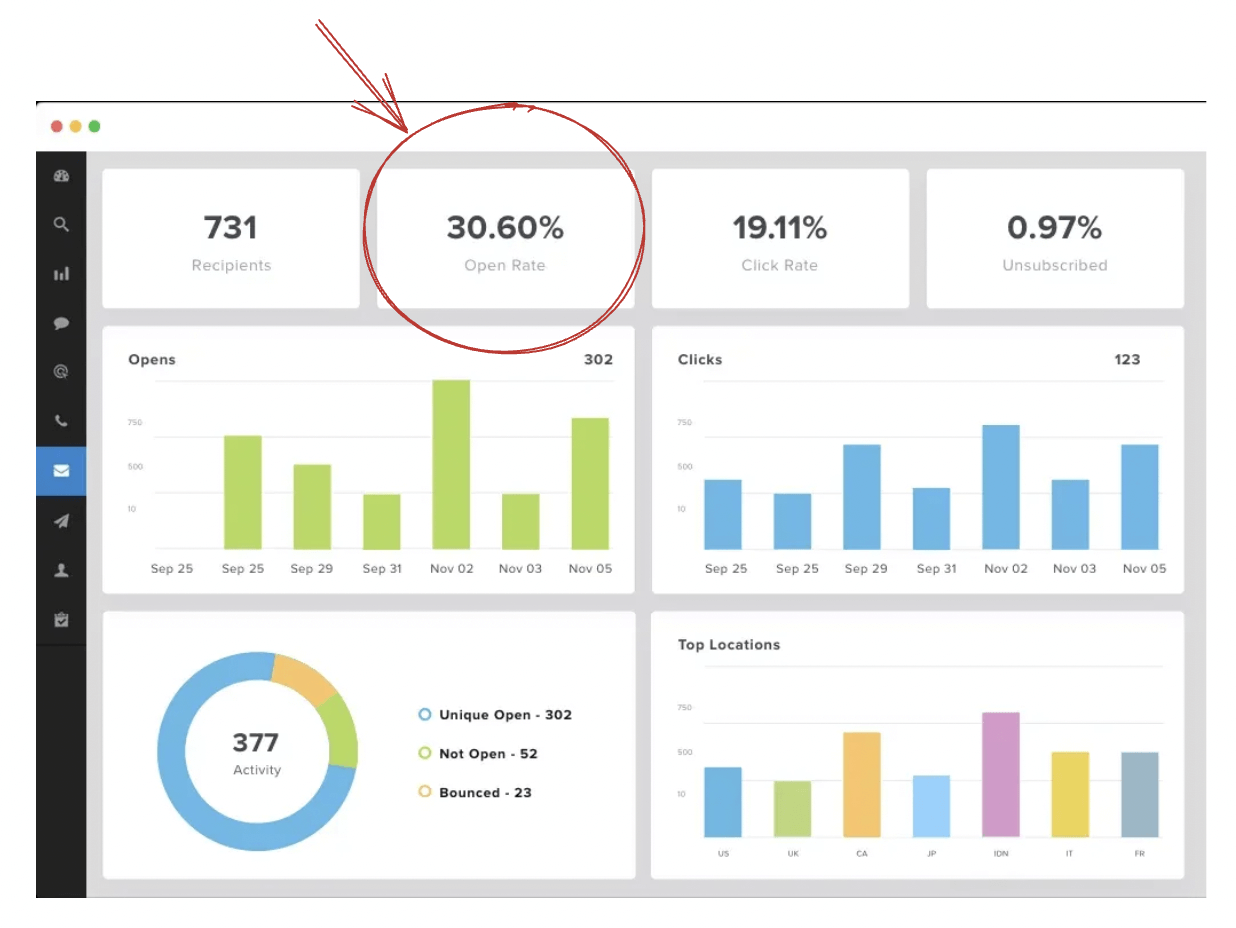
How the open rate is shown in the Mailchimp dashboard
How to calculate open rates: Divide the total number of emails that have been opened by the number of recipients. Multiply by 100 for a percentage.
High open rates usually mean your subject lines are compelling (big tick) or that your subscribers eagerly anticipate your email in their inbox. If your open rates are particularly low, it might mean you’re not doing enough to stand out in busy inboxes.
Start by comparing your open rates to the industry norms. For example, tech services have a much lower open rate (19%) than, say, travel and tourism (39%). It makes sense that people are more likely to open email campaigns about their favorite holiday destinations than an email marketing campaign about the tool they have to use for work every day.
As a general rule of thumb though, if your open rates start slipping below 15-20%, it’s time to sit up and take notice.
Caveat: Open rates aren’t always as transparent as they seem. Some email platforms let people read an email in a preview window without “opening” it, yet this won’t be counted as an “open”. And some opens are actually bot-driven rather than performed by an actual person – learn why in our article on bot clicks and opens in email marketing reports.
New privacy policies are also making it harder to get cold, hard facts. For example, Apple Mail Privacy Protection hides IP addresses and privately downloads email content, marking it as “open” even if it hasn’t been.
How to improve your email open rates
- Experiment with subject lines and A/B test different versions (learn more about email A/B testing in our how-to guide)
- Try incorporating emojis
- Use personalization in your subject lines
- Try sending your emails at different times throughout the day
- Invoke a sense of curiosity to stand out
Real-life example: Hotel brand increases open rates by 57%
The SEMI Superior Kinderhotel was keen to improve its email marketing campaigns—in particular, its open rates. Instead of running subject line tests, the brand decided to experiment with the sender name (a feature that’s often overlooked). This was a strategic attempt to capture the attention of people checking their emails on the go, since including a real person’s name as the sender instead of a brand can be a powerful motivator to open an email.
The hotel tested two sender name variations:
- Using the hotel’s brand name
- Using a real person’s name
The email that included the real person’s name (Michaela, in this case) generated 57% more opens than the branded sender name.
(By the way, if you also run a hotel, make sure to check out our comprehensive guide on email marketing for hotels.)
3. Click-through rate
Click-through rate (CTR) measures how many people clicked on a link in your email. So, not only have they opened your email but they’ve gone one step further and engaged with the content inside.
This is often used as the Holy Grail of email marketing KPIs because it basically evaluates the number of people who opened the email and the number of clicks in one go.
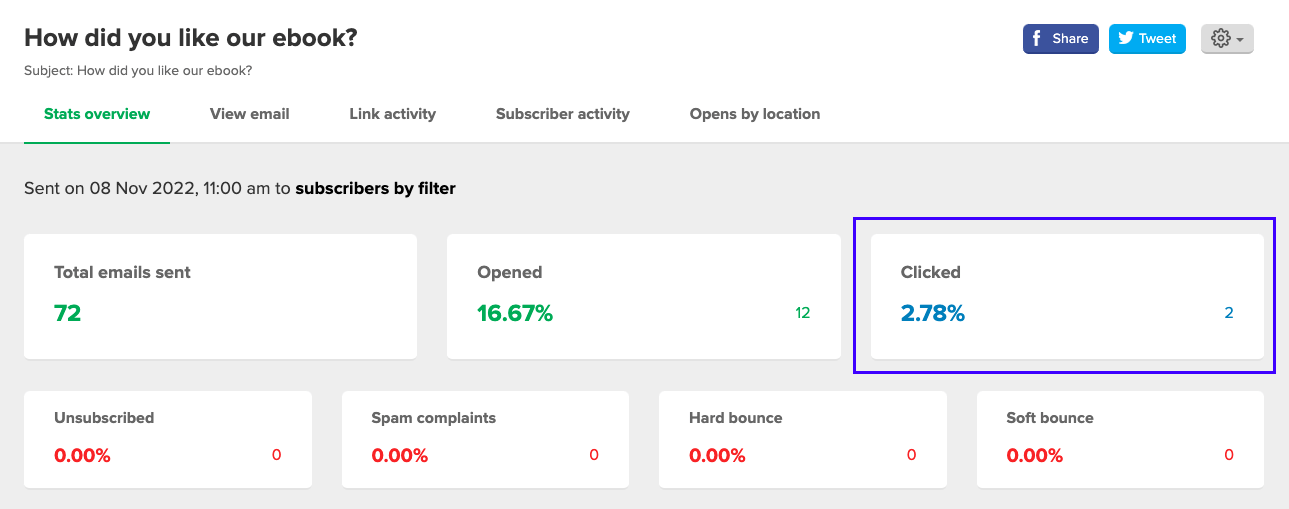
How click-through rate is shown in MailerLite
How to calculate click-through rate: Divide how many people clicked on a link by how many emails were delivered. Multiply by 100 for a percentage.
Again, CTR will vary depending on your industry. For example, retail has a much lower average CTR (0.7%) than education (4.4%). The sweet spot is anywhere between 2-5%.
High click-through rates indicate your emails are engaging enough to warrant people to take action. If they’re a little on the low side, it might mean the content of your email doesn’t match the subject line or you’re burying your call-to-action (CTA) amongst too much fluff.
Caveat: You can also track the click-to-open rate (CTOR) by dividing how many people clicked on a link by how many emails were opened. However, this comes with a lot of little issues as mentioned above, like ESPs marking emails as opened when they haven’t been.
There are some downsides to CTR too. It can tell you that somebody clicked a link, but not why they clicked or what they did after they clicked. Without that information, CTR can’t tell you the full story.
How to improve click-through rates
- Make sure the emails you’re writing are relevant to your audience and the stage they’re at in their buying cycle
- Experiment with different sending times
- Switch up your CTA
- Include an incentive for people to click through
Real-life example: SuperOffice increased CTR by 53%
SuperOffice increased its click-through rate by a huge 53% from 4.41% to 6.76%. It did this by adding images and a brightly colored CTA button to its emails – something you could easily try in your own campaigns.
4. Unsubscribe rate
It’d be wonderful if every single person who received your emails absolutely loved them, but that’s not always the case. Sometimes a subscriber has grown out of the content you’re sharing or your emails are no longer relevant to them. Either way, you don’t want someone to stick around if they’re not having a nice time.
That’s what your unsubscribe rate measures: How many people opt out of receiving emails from you.
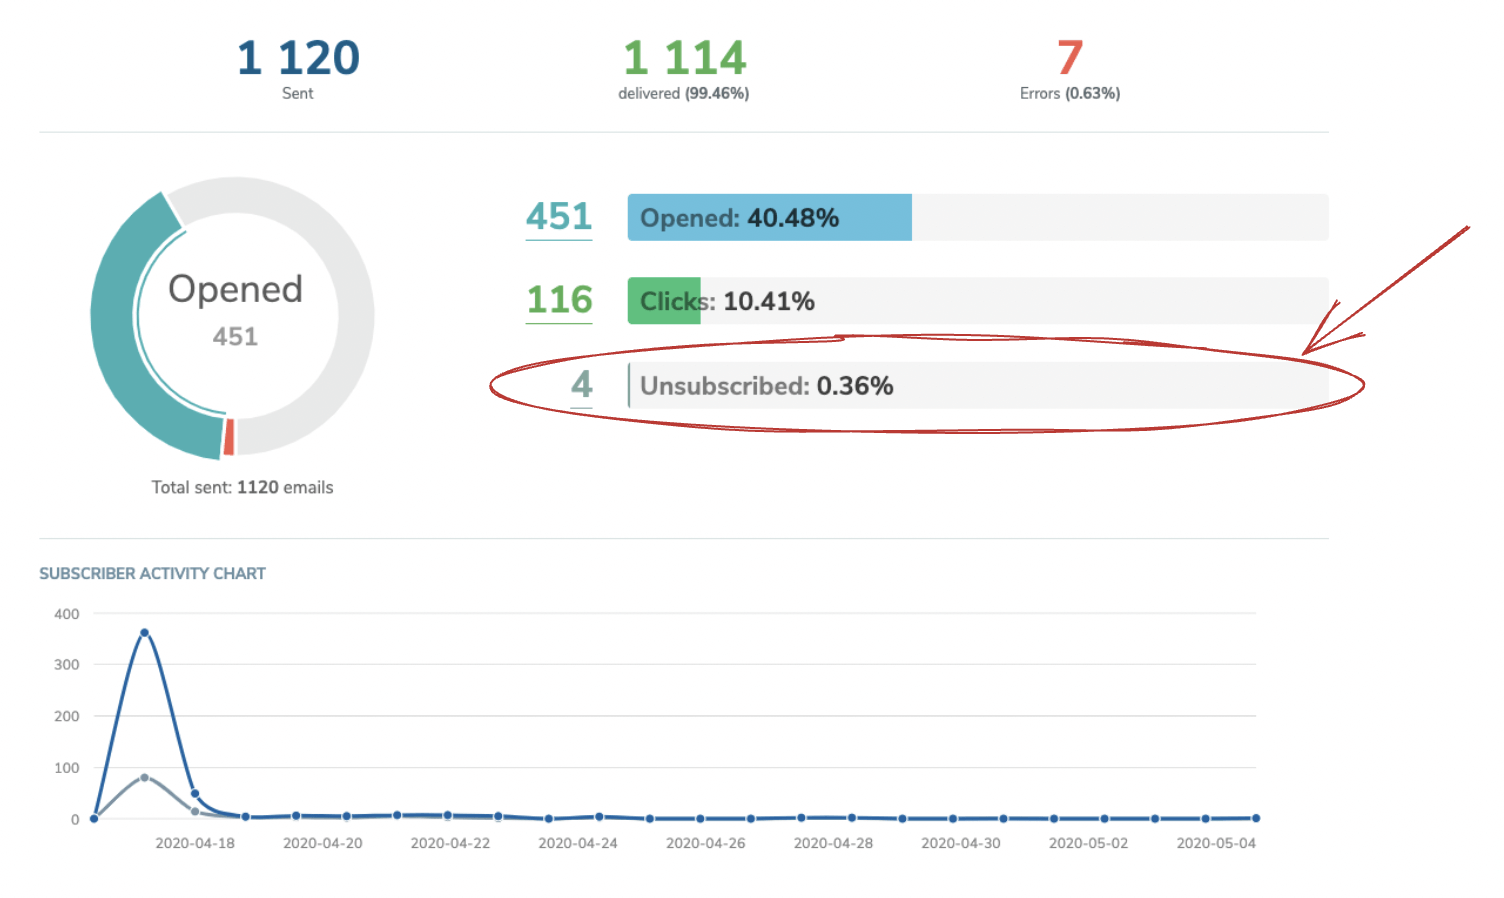
How unsubscribe rate is shown in SendPulse
How to calculate your unsubscribe rate: Divide how many people unsubscribed from an email by how many emails were delivered. Multiply by 100 for a percentage.
The lower the better when it comes to unsubscribe rates. On average, they hover around 0.17%, but you should only really start to worry if they get up to 0.5%. High rates could indicate your emails aren’t delivering on their promise or you’re overwhelming subscribers with too many emails.
Caveat: Unsubscribe rates tell you when someone unsubscribed, but they don’t tell you why they unsubscribed. This can often leave you guessing, especially if it’s someone who was once an avid reader. If your unsubscribe rates are going up, it could be a good idea to do an analysis of your email content over the past few months to see if anything has changed in that time. Many ESPs also let you add a survey on your unsubscribe page.
How to improve your unsubscribe rate
- Experiment with how many times you email subscribers each week, or give subscribers the option to choose email frequency
- Keep content digestible and relevant. You could also consider setting up a preference center to let subscribers pick the topics they want to hear about
- Segment your email list so subscribers are getting content that’s relevant to them
- Regularly cleanse your email list
- Use a double opt-in to make sure people want to join your list
5. Bounce rate
Bounce rate tracks how many emails couldn’t be delivered to your subscriber’s inboxes. There are two types of bounces that it counts:
- Hard bounces: These are permanent blocks, usually indicating an invalid email address or one that doesn’t exist/is no longer active. It’s best to cull hard bounces from your list because your emails will never get to their intended destination.
- Soft bounces: These are temporary blocks, usually because the recipient’s inbox is full or the server is temporarily down. Your email provider will try to resend your email a few times until it gets through.
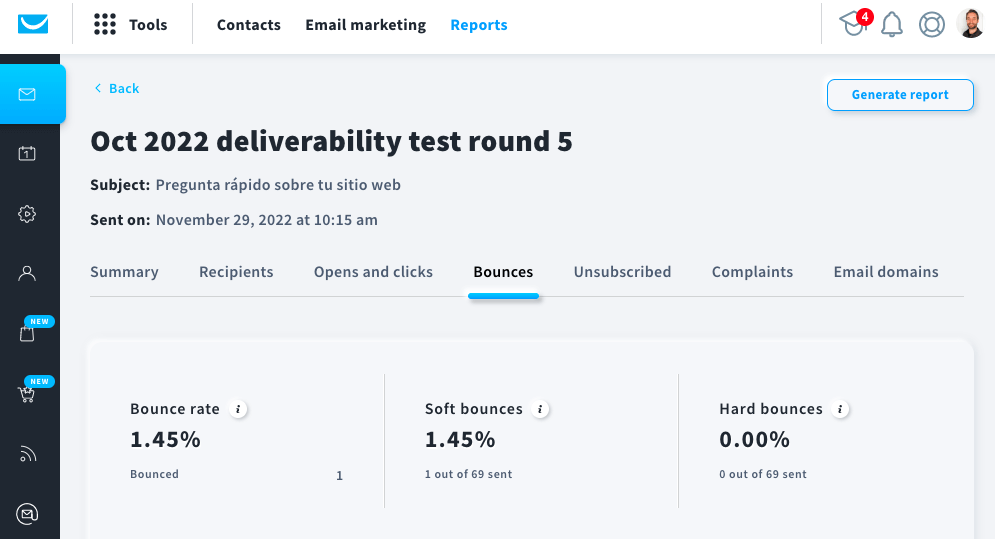
How bounce rate is shown in GetResponse
How to calculate bounce rate: Divide the number of emails that bounced by how many emails were sent in total. Multiply by 100 for a percentage.
Benchmark reports from big names in the email marketing world suggest 1% is an average bounce rate, but in general, anything less than 2% is good. Anything higher, and it could be a sign that you’re using poor software, have a bad sender reputation, or have low-quality opt-ins that are a magnet for spammy emails.
How to improve your bounce rate
- Remove email addresses that have hard bounced from your list – any good ESP will do that automatically
- Choose your email provider wisely—emails sent from freebie software are often a red flag for servers
- Use clean and simple code (if necessary)
Real-life example: Copyhackers reduces bounce rate
Copywriting education brand Copyhackers already had a fairly low bounce rate at 0.36%, but they managed to get it even lower to 0.22% by regularly cleaning their email list, and removing catch-all email addresses (which are more prone to bouncing) plus those in the “do not mail” category.
6. Conversion rate
Your email marketing goal probably isn’t to send “Dear John” letters to your subscribers every week. You probably want to encourage them to do something at some point, like buy your product, sign up for a class, or download a guide. This is what your conversion rate will track. It’s essentially the percentage of subscribers who performed a specific action (like signing up, buying, or downloading).
How to calculate conversion rate: Divide how many people took a specific action by the number of emails that were delivered. Multiply by 100 for a percentage.
Average conversion rates vary depending on the industry (no surprise). For example, ecommerce conversion rates are notoriously low (1.8%), while the automotive industry has a particularly high average conversion rate of 3.9%. Research has shown that across 14 major industries, the average conversion rate is 2.6%, so aim for anything above 2%.
If your conversion rate is dipping lower than that, it might mean your CTA isn’t clear, you aren’t conveying the value of your offer, or you’re talking to the wrong people.
How to improve your email conversion rate
- Double-check your design is mobile responsive
- Experiment with stronger CTAs
- Ensure your landing page is in keeping with your emails and branding
- Try out different messaging and copy
Real-life example: EverWash achieved a 37% email conversion rate
Car wash app EverWash increased its email conversion rates to 37% by creating an engaging onboarding email drip sequence with personalized messaging. They also used upsells to convert more existing customers who had already shown an interest in the brand’s services.
7. Spam complaints
Nobody wants to be labeled as spam, especially when you’ve put blood, sweat, and tears into creating engaging emails. But it happens. Spam complaints measure how many people have marked your email as spam 😢 and, if it’s not dealt with, it can turn into a vicious cycle. The more complaints you get, the higher the chance that your future emails will also end up in the barren wasteland of your subscriber’s spam folders.
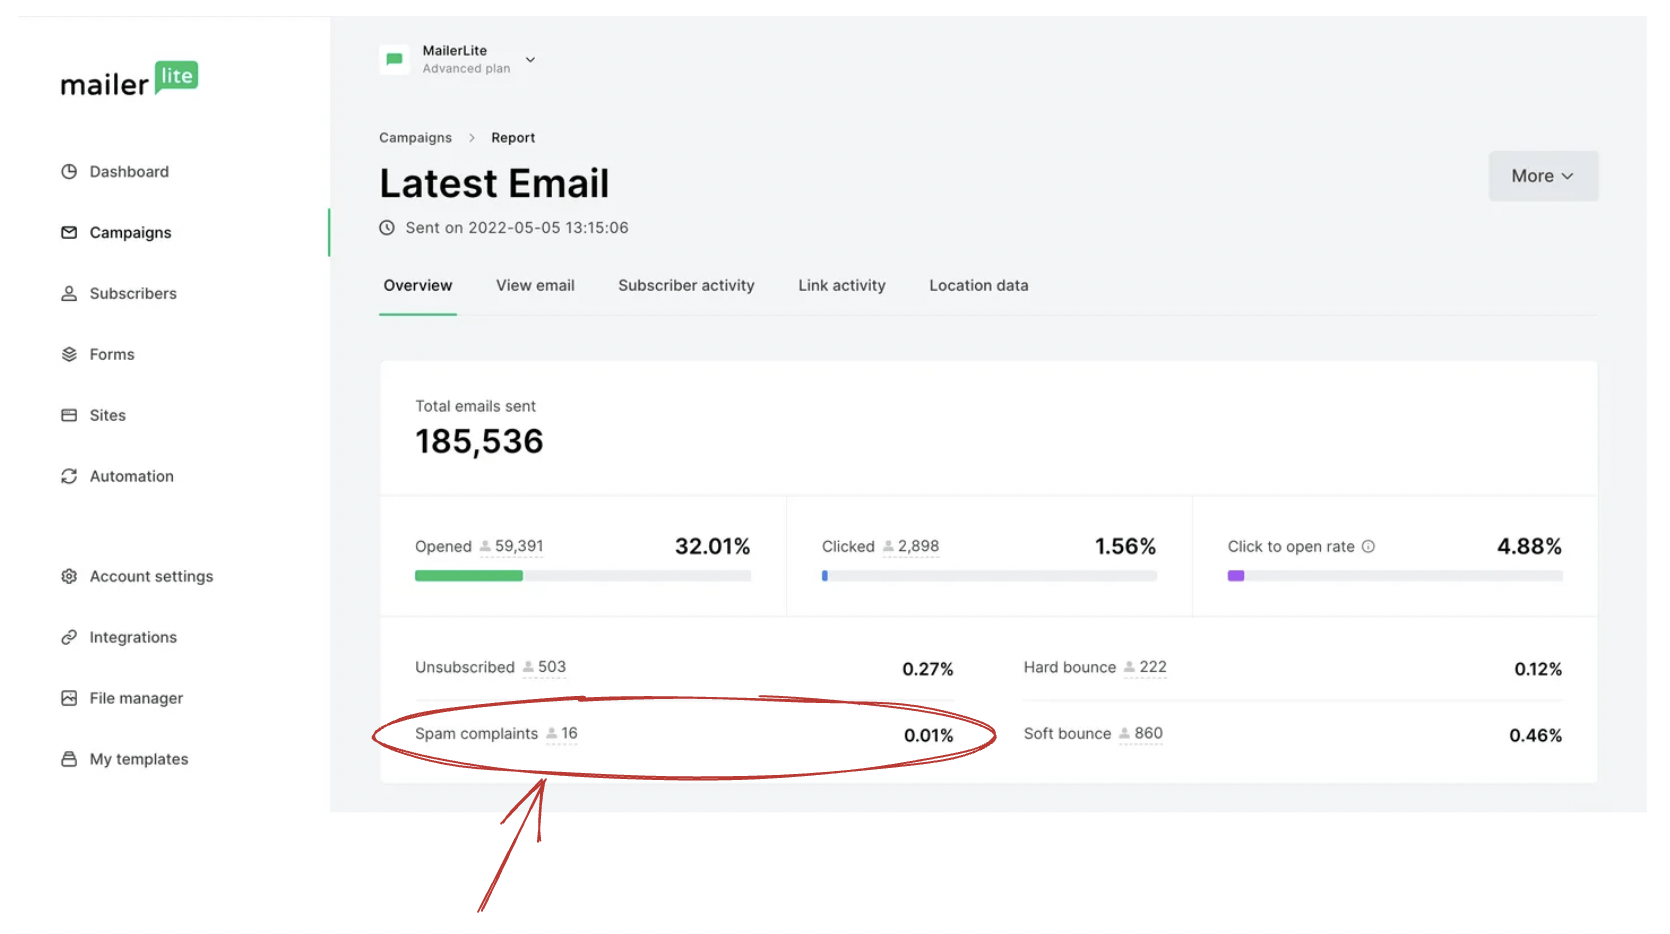
How spam complaints data is shown in MailerLite
How to calculate spam complaints: Divide how many people reported an email as spam by the total number of emails that were sent. Multiply by 100 for a percentage.
Ideally, your spam rate should sit pretty at precisely 0%. If it’s not, it could indicate that you’re not setting subscriber expectations upfront, your emails look and feel spammy, or the provider you’re using is cheap and causing you problems. The downside is you don’t know why someone has labeled your email as spam. They might have slipped and accidentally clicked it, or they might have struggled to find the unsubscribe button so went nuclear. But, there are a few things you can do to try to keep this number to a minimum.
How to improve your spam complaint rate
- Make the unsubscribe link visible and accessible in every email (and definitely don’t try to hide it!)
- Enable a double opt-in to check subscribers definitely want to join your list
- Avoid spammy subject lines
- Don’t use a cheap and cheerful email marketing tool
8. Forwarding rate
One of the best compliments you can get from a subscriber is a referral to their friends and family. It’s the ultimate “you’re good and I like you” statement. Your email forwarding (or sharing) rate tracks how many people have done this by clicking either a “share this” button or a “forward to a friend” button in your email. Most email service providers let you add these as trackable links.
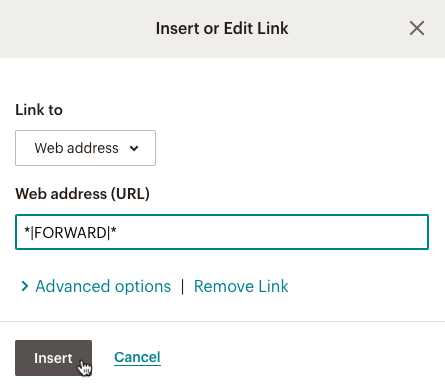
Adding ‘Forward to a friend’ links in Mailchimp
How to calculate email forwarding rate: Divide how many emails were delivered by the number of times someone clicked on the “share this” button. Multiply by 100 for a percentage.
There’s no average you should be looking to smash here—not every email has a “share this” button, so it can be tricky to track. On top of this, you can’t measure when someone clicks the native “forward” button in their email platform. A forward also doesn’t mean a new subscriber. They might not sign up after receiving the email, but they might click a link, visit your website, or take another action.
That said, they can be useful to track over time, to get a sense of whether subscribers are engaging more or less with your emails.
How to improve your email forwarding rate
- Provide a clear CTA that encourages people to share your email
- Offer an incentive or a reward when someone successfully refers a certain number of people
- Ensure your emails are insightful and engaging
9. List growth rate
The bigger the list the better (but only if you have the right people on your list) and, for many companies, adding subscribers to their list is the ultimate kryptonite. Tracking your list growth rate will show you how effective your lead generation efforts are and how quickly you’re attracting new potential customers.
How to calculate list growth rate: Divide how many net new subscribers you got over a set period of time by the total number of people on your list. Multiple by 100 for a percentage.
Research by the Data & Marketing Association revealed the average list growth rate is 2.5%. Sounds low, but if you put it into numbers it all adds up. If you have 1000 subscribers and a 2.5% list growth rate, that means you’re adding 25 people to your email list each month. That’s 25 new potential customers.
How to improve your list growth rate
- Use clear CTAs on your landing pages and sign-up pages
- Offer an incentive for people to subscribe, like a free download or a percentage off their first purchase
- Place plenty of sign-up forms around your website and across your main marketing channels
Real-life example: Alyssa Dulin grew her email list by 46%
Kit’s Head of Deliverability, Alyssa Dulin, managed to grow the email list for her newsletter, Deliverability Dispatch by 46% by partnering with other relevant creators and relying on recommendations.
10. ROI
ROI (or Return on Investment) shows you how much you’re making from your emails against how much you spent on sending them. It takes into account any money you spent on ads to drive people to your sign-up pages, the cost of your email marketing provider, and if you’ve hired help to actually write the emails.
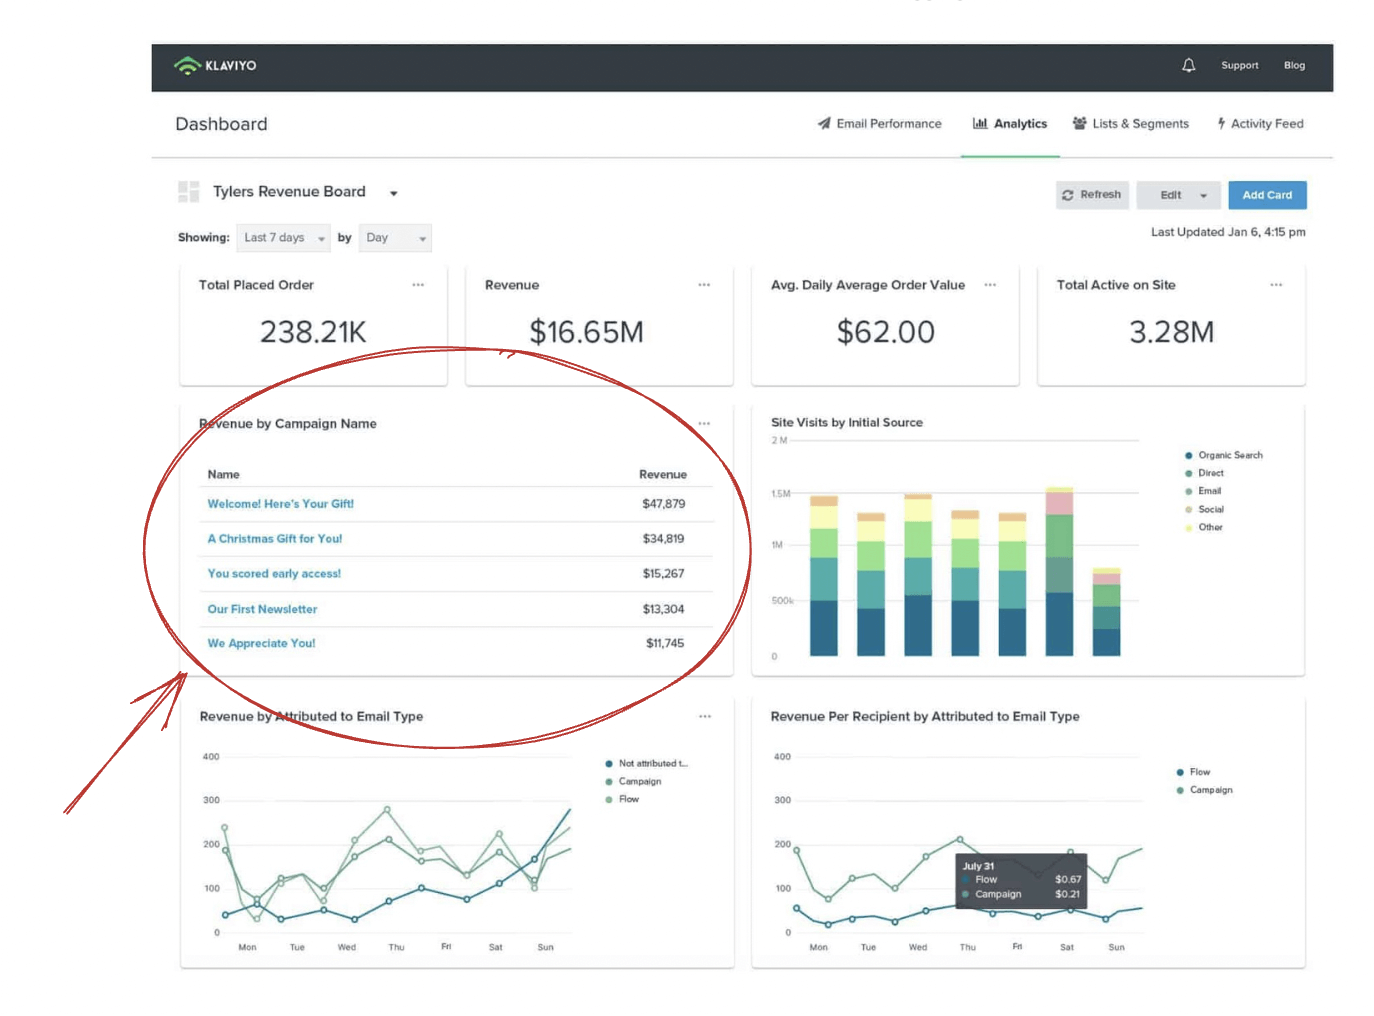
How Klaviyo shows the revenue from each email
How to calculate email ROI: Divide your total revenue from the email campaign or individual email by the total amount you spent on it. Multiply by 100 for a percentage.
Email marketing has a famously high ROI. On average, it generates $36 for every $1 spent, which is a massive ROI of 3500%. Even if you don’t hit those heady numbers, the main thing is that you continue to make more from your emails than you spend on sending them.
The hardest part about tracking ROI from emails is it’s not always clear how somebody came to be a customer. For example, a subscriber might find out about your new product line via email but then visit your website directly two weeks later to make a purchase. They initially learned about your products from email but they didn’t purchase using that channel.
How to improve your email ROI
- Experiment with conversion optimization strategies
- Segment your list and send relevant, personalized emails
- Try out different CTAs
- Add an incentive to encourage subscribers to take action
Real-life example: Leonisa generates 45.6x ROI
Lingerie brand Leonisa increased ROI by 45.6x through a healthy mix of email segmentation, detailed post-purchase email sequences, and adding social proof to their email marketing campaigns.
Start paying attention to your email marketing KPIs
It’s time to put this all into action.
The email marketing KPIs you choose to track closely will ultimately depend on your big-picture goals. If the aim of your newsletter strategy is to grow brand awareness, you might focus on your list growth rate, but if you’re keen to get more eyeballs on your content, maybe open rates and click-through rates are more important to you.
Start by identifying which email marketing metrics are most aligned with your goals and start testing. Try some of the practical tips we’ve covered here to improve your metrics and continue to create email marketing campaigns that hit the spot every single time.
Need help implementing effective email campaigns? Check out our email marketing guide for helpful tips and tricks.
The authors
Learn more about us

Our Methodology
This article has been written and researched following our EmailTooltester methodology.
Our Methodology